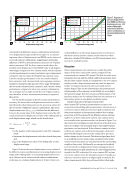
ABSTRACT Composite materials are widely used in engineering because of their high strength, high modulus, and corrosion resistance. Accurately obtaining the mechanical properties of composites is helpful for their further development. However, in a uniaxial tensile test, the strain distribution between the front and back of the composite sheet sample may differ due to its heterogeneity, and its stress-strain curve depends on which side the strain is measured. To report the stress-strain curve more accurately, a multicamera digital image correlation (DIC) system was employed to measure the double-sided strain in this work. Two sets of 3D digital image correlation (3D-DIC) systems were placed in front of and behind the specimen to record the tensile process of the specimen, and a double-sided calibration technique was implemented to connect the two sets of 3D-DIC systems into a unified coordinate system. Young’s modulus, percent bending, and local strain history are analyzed based on the measurements of strain on both sides. The results show that the strain on both sides of the composite is not exactly same, especially in the strain concentration area. As a comparison, the strain distribution on both sides of the metal material is almost identical. KEYWORDS: multicamera DIC, composite materials, material properties, Young’s modulus, percent bending Introduction Composite materials are widely used in the aerospace and auto- mobile industries because of the advantages of high strength and light weight, so research on the mechanical behavior of composite materials is particularly important (Clyne and Hull 2019 Booysen 2022). The uniaxial tensile test is one method used to measure the mechanical properties of materials. Engineers draw stress-strain curves to obtain important parameters of the material, such as Young’s modulus, work hardening exponent, ultimate stress, and so forth (Hart 1967). Usually, the stress data is recorded by a tensile machine, and the measurement of strain can be divided into contact measurements and noncontact measurements. The most widely used contact measurement is the contact extensometer, which can obtain engineering strain results in the gauge length range. With the development of optical measurement technology, noncontact measurement has gained more and more attention. Optical extensometers are one such method, with proven reliabil- ity and repeatability (Hercher 1989 Shinoda and Bathurst 2004 Fauster et al. 2005). However, measuring material strain with extensometers still faces two challenges. First, whether it is a contact exten- someter or an optical extensometer, measurement results can only provide the average strain within the gauge length range, and the local strain cannot be obtained during the tensile test process. Although the local strain can be obtained by attaching a strain gauge, it can only measure the strain in one direction at a certain point and cannot achieve a full-field measurement. Second, it is not suitable for the extensometer to measure composite materials during the tensile test. Some composite materials are brittle materials that release enormous amounts of energy at the moment of failure, potentially damaging the extensometer. Composite materials may be heterogeneous due to their complex molding process. This leads to the neu- tral plane being not coincided with the midplane. Additional bending stress is introduced in the uniaxial tensile tests. The material has a strain higher than the average strain on one side and lower than the average strain on the other side (Fauster et al. 2005). The difference in strain on both sides of the material cannot be reflected by the extensometer measurement results. To overcome the shortcomings of extensometer measure- ment, digital image correlation (DIC), as a noncontact full-field optical measurement method, has been playing an important role in the field of nondestructive testing in recent decades since it was first proposed by Peters and Ranson (1982) , Sutton et al. (1983) , and Yamaguchi (1986) . The basic principle of this method is to capture the speckle deformation process on the EXPERIMENTAL INVESTIGATION OF DOUBLE-SIDED STRAIN OF COMPOSITES IN TENSILE TESTING USING MULTICAMERA DIC SIYUAN FANG*, XIAOWAN ZHENG*‡, BICHENG GUO*, DANIELLE ZENG§, AND LIANXIANG YANG† * Department of Mechanical Engineering, School of Engineering and Computer Science, Oakland University, Rochester, USA † Department of Mechanical Engineering, School of Engineering and Computer Science, Oakland University, Rochester, USA yang2@oakland.edu ‡ College of Electrical and Information Engineering, Zhengzhou University of Light Industry, People’s Republic of China § Research and Advanced Engineering, Ford Motor Co., Dearborn, USA Materials Evaluation 80 (11): 42–51 https://doi.org/10.32548/2022.me-04283 ©2022 American Society for Nondestructive Testing ME | TECHPAPER 42 M AT E R I A L S E V A L U AT I O N • N O V E M B E R 2 0 2 2

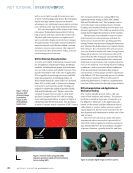
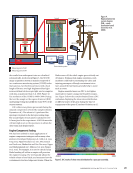
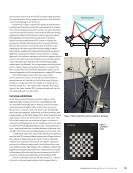
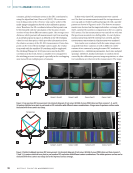
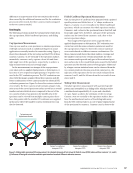
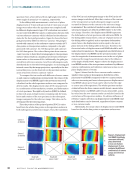
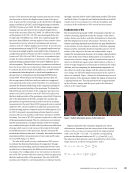
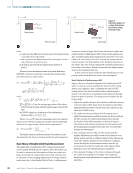
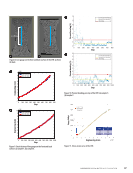
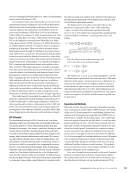
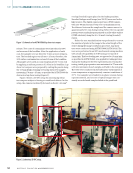
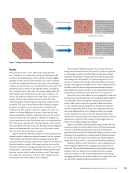
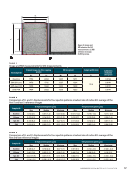
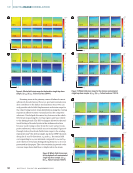
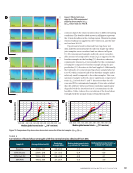
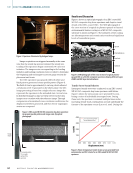
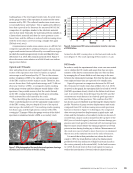
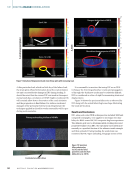
surface of the specimen through cameras and use the correla- tion function to obtain the displacement/strain of the speci- men. In general, DIC technology can be divided into 2D digital image correlation (2D-DIC) and 3D digital image correlation (3D-DIC) (Sutton et al. 2009). 2D-DIC adopts single-camera imaging and can only measure the in-plane displacement/ strain of the specimen (Pan et al. 2009). To address the techni- cal limitations of 2D-DIC, 3D-DIC was developed (Kahn-Jet- ter and Chu 1990 Helm et al. 1996). Two cameras image the specimen from different viewing angles to form a stereo vision measurement system, which can simultaneously measure in-plane and out-of-plane displacement/strain. In recent years, strain measurement using 3D-DIC in uniaxial tensile tests has become increasingly popular, especially for the evaluation of composite properties (Wang et al. 2010 Catalanotti et al. 2010 Laurin et al. 2012 He et al. 2016). However, as mentioned pre- viously, the strain distribution on both sides of the composite material during uniaxial tensile tests may be different due to its heterogeneity. The material property parameters calculated from the stress-strain curve depend on which side is measured. To indicate the front to back strain difference, in 2000 ASTM recommended attaching back-to-back axial transducers to the specimen to evaluate percent bending (ASTM Interna- tional 2000). When the percent bending is greater than 3%, the average strain of the front and rear surfaces is suggested to be reported as the strain result. Therefore, it is necessary to measure the double-sided strain of the composite material to evaluate the percent bending of the specimen. To obtain the full-field strain on both sides of the composite specimen, Jus- tusson et al. (2013) used two sets of 2D-DICs to be placed on the front and rear sides of the specimen, respectively. However, due to the limitations of 2D-DIC, possible out-of-plane dis- placements in experiments can introduce errors for in-plane measurements. Pan and Chen (2019) proposed mirror-assisted multiview DIC, which enables front and back measurements of objects using only two cameras and a set of flat mirrors. Li et al. (2017) proposed a measurement scheme based on a mul- ticamera DIC system together with Dantec-Dynamics GmbH, Germany. Two sets of 3D-DIC systems are placed on either side of the measurement sample. The two systems are not isolated, but the measurement coordinate systems of the two systems are combined through a double-sided synchronous calibration strategy, which can not only measure the strain in the length and width directions of the specimen, but also measure the strain in the thickness direction. Currently, this method enables experimental direct measurements of true strain and R-value (Li et al. 2018 Fang et al. 2021). The aim of this work is to use a multicamera DIC system to evaluate the front and back strain of composites. Young’s modulus, percent bending, and local strain history were used as indicators to characterize the difference between front and rear strains. The configuration of our test system is to form two sets of 3D-DIC systems with four cameras, which are placed on the front and rear sides of the specimen. Two sets of 3D-DIC systems can be linked to one measurement coordinate system through a special double-sided calibration method. The front and back strain of composite and metal materials in uniaxial tensile tests were investigated to verify the feasibility and accuracy of the multicamera DIC system measurements. Fundamentals of DIC The measurement principle of DIC technology is that the cor- relation matching algorithm tracks the changes of the object surface feature area before and after deformation to obtain the full-field displacement/strain information. However, the cor- relation matching algorithm may fail due the gray distribution on the surface of most objects is uniform. Therefore, spraying black and white randomly distributed speckle patterns on the surface of the object has become an indispensable step to realize DIC measurement because of its unique characteristics. The state of the object before deformation is recorded by the camera as a reference image, and the measurement region of interest is divided into square grids called subsets or facets. A series of target images are continuously recorded as the object deforms, and by comparing the deformation magnitudes of the subsets in each target image with the subsets in the refer- ence image, the full-field displacement/strain in the region of interest is obtained. Figure 1 shows the deformation process of whole subsets of the specimens within the region of interest in a uniaxial tensile test. The red grid shows the original subsets in the reference image, and the green grid is the deformed subsets in the target image. Figure 2 illustrates the schematic diagram of a subset deformation. Assuming that the center point of the original subset is P(xp,yp), Q(xq,yq) is any point in the original subset with a size of (2M + 1) × (2M + 1), and the corresponding points in the deformed subset are P ′ ( xp yp) and Q ′ ( xq y′ q ). The amount of deformation can be quantified by a first-order shape function, as shown in Equations 1 and 2: (1) xq = xp + ∆ x + u + ∂ u ∂ x ∆ x + ∂ u ∂ y ∆ y (2) yq = yp + ∆ y + v + ∂ v ∂ x ∆ x + ∂ v ∂ y ∆ y Figure 1. Subset deformation process in the tensile test. N O V E M B E R 2 0 2 2 • M AT E R I A L S E V A L U AT I O N 43
ASNT grants non-exclusive, non-transferable license of this material to  .
All rights reserved. © ASNT 2026. To report unauthorized use, contact: customersupport@asnt.org