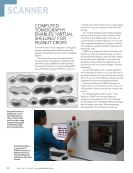
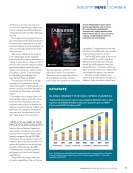
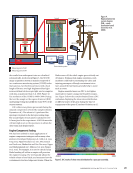
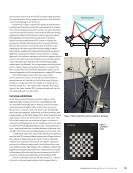
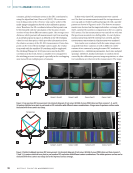
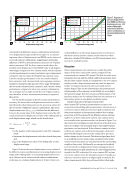
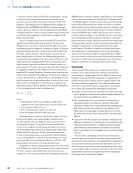
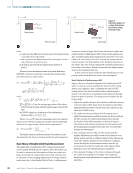
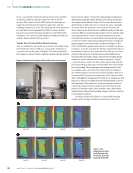
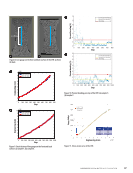
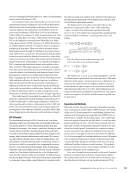
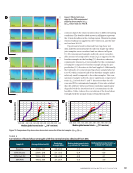
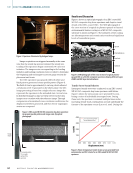
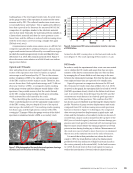
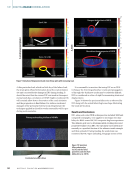
Tensile Test of Extra-Deep-Drawing Steel Extra-deep-drawing steel (EDDS) samples with a width of 15.01 mm and a thickness of 1.02 mm were used as a metal material for tensile testing to compare the mechanical behavior of composite materials. Figure 15 illustrates the distribution of surface strain at different steps. It can be clearly found that the front and rear surface strains are almost identical in the same step. The stress-strain curves plotted from front surface strain, back surface strain, and average strain are shown in Figure 16, which is typical behavior for ductile materials. The three stress-strain curves almost completely coincide except for the final necking stage. The Young’s modulus was calculated based on the elastic phase data as 121.72, 121.14, and 121.46 GPa. The percent bending graphs are plotted in Figure 17. The average percent bending is 1.60% and standard deviation is only 0.5%. Compared with the laminate results, it is only a few steps above 3% bend percentage, which is much less than the laminate data. The results from the aforementioned data show that the metal material behaves homogeneously during the tensile test, so it is reasonable and reliable for the strain on either side to be measured and reported. Conclusion An alternative method for front and back strain measurement of composite materials based on a multicamera DIC system is presented in this paper. The front and back full-field strain of the composites was measured in the whole uniaxial tensile test. The stress-strain curve specimen, Young’s modulus, and percent bending were calculated from the front and back strain history. Although the Young’s modulus of the two sides of the laminate is not very different, the stress-strain curve and the percent bending reveal that the specimen is subjected to a bending couple at the initial loading. Additionally, the full- field strain results offer the possibility of finding local strain concentrations. The measured strain results show that the size and area of strain concentration on the front and back of the laminate are not exactly the same, which is of great signifi- cance for studying the fracture mechanical behavior of com- posites. Futhermore, the front and back surface strain maps can also be used as a prediction of the crack propagation path. Compared with the composite material, the mechanical behavior of the front and back of the metal material is almost the same due to its homogeneity. Therefore, the multicamera DIC system provides potential for studying the mechanical properties of heterogeneous composite materials. Although the advantages of the multicamera DIC system in the measurement of composite materials has been verified in this work, the detailed reasons for the different strain con- centration regions before and after composite materials still need further research, especially the generation and propaga- tion modes of surface cracks. REFERENCE ASTM. 2000. ASTM D3039/D3039M-00: Standard test method for tensile properties of polymer matrix composite materials. ASTM International, West Conshohocken, PA. Booysen, F. 2002. “An overview and evaluation of composite indices of development.” Social Indicators Research 59 (2): 115–51. https://doi. org/10.1023/A:1016275505152. Catalanotti, G., P.P. Camanho, J. Xavier, C.G. Dávila, and A.T. Marques. 2010. “Measurement of resistance curves in the longitudinal failure of composites using digital image correlation.” Composites Science and Tech- nology 70 (13): 1986–93. https://doi.org/10.1016/j.compscitech.2010.07.022. Chen, X., L. Yang, N. Xu, X. Xie, B. Sia, and R. Xu. 2014. “Cluster approach based multi-camera digital image correlation: Methodology and its appli- cation in large area high temperature measurement.” Optics & Laser Tech- nology 57: 318–26. https://doi.org/10.1016/j.optlastec.2013.08.005. Clyne, T. W., and D. Hull. 2019. An introduction to composite materials. Cambridge university press. https://doi.org/10.1017/9781139050586. Fang, S., Y. Fang, X. Zheng, B. Guo, L. Yang, D. Zeng, and Z. Li. 2022. “Large-angle full-field strain measurement of small-sized objects based on the multi-camera DIC test system.” SAE Technical Paper 2022-01-0274. https://doi.org/10.4271/2022-01-0274. Step 7 6 5 4 3 2 1 0 0 100 200 300 400 500 600 700 800 900 Each step percent Average percent 3% St 1 0 4 0 7 0 h bbendingginden A ge p bbendingginden 3 bbendingginden Figure 17. Percent bending per step of the EDDS. Engineering strain 350 300 2500 200 150 100 50 0 0 0.05 0.1 0.15 0.2 Front side dataad Back side datad Average datad Surface Young’s modulususlodum (GPa)a)G( Frront 121.7227.1 Back 121.1414.21 Average 121.4612 Engineering 2 1 1 0. 5 0 2 00.255. si e B k si e A Surface ’s rage Figure 16. Stress-strain curve of the EDDS. 50 M AT E R I A L S E V A L U AT I O N • N O V E M B E R 2 0 2 2 Percent bending (%) g Stress ((MPa) )

Fang, S., X. Zheng, G. Zheng, B. Zhang, B. Guo, and L. Yang. 2021. “A New and Direct R-Value Measurement Method of Sheet Metal Based on Multi-Camera DIC System.” Metals 11 (9): 1401. https://doi.org/10.3390/ met11091401. Fauster, E., P. Schalk, and P.L. O’Leary. 2005. “Evaluation and calibration methods for the application of a video-extensometer to tensile testing of polymer materials.” In Machine Vision Applications in Industrial Inspection XIII 5679: 187–198. https://doi.org/10.1117/12.586734. Genovese, K., L. Cortese, M. Rossi, and D. Amodio. 2016. “A 360-deg digital image correlation system for materials testing.” Optics and Lasers in Engi- neering 82: 127–34. https://doi.org/10.1016/j.optlaseng.2016.02.015. Hart, E.W. 1967. “Theory of the tensile test.” Acta Metallurgica 15 (2): 351–55. https://doi.org/10.1016/0001-6160(67)90211-8. He, T., L. Liu, A. Makeev, and B. Shonkwiler. 2016. “Characterization of stress–strain behavior of composites using digital image correlation and finite element analysis.” Composite Structures 140: 84–93. https://doi. org/10.1016/j.compstruct.2015.12.018. Helm, J.D., S.R. McNeill, and M.A. Sutton. 1996. “Improved three-di- mensional image correlation for surface displacement measurement.” Optical Engineering (Redondo Beach, Calif.) 35 (7): 1911–20. https://doi. org/10.1117/1.600624. Hercher, M. 1988. Non-contact lateral displacement sensor and exten- someter system. US Patent 4,872,751, filed 14 January 1988, and issued 10 October 1989. Justusson, B.P., D.M. Spagnuolo, and J.H. Yu. 2013. Assessing the appli- cability of digital image correlation (DIC) technique in tensile testing of fabric composites. Report. Army research lab aberdeen proving ground MD weapons and materials research directorate. https://doi.org/10.21236/ ADA571047. Kahn-Jetter, Z.L., and T.C. Chu. 1990. “Three-dimensional displace- ment measurements using digital image correlation and photogrammic analysis.” Experimental Mechanics 30 (1): 10–16. https://doi.org/10.1007/ BF02322695. Laurin, F., J.S. Charrier, D. Lévêque, J.F. Maire, A. Mavel, and P. Nuñez. 2012. “Determination of the properties of composite materials thanks to digital image correlation measurements.” Procedia IUTAM 4: 106–15. https://doi.org/10.1016/j.piutam.2012.05.012. Li, J., G. Yang, T. Siebert, M.F. Shi, and L. Yang. 2018. “A method of the direct measurement of the true stress–strain curve over a large strain range using multi-camera digital image correlation.” Optics and Lasers in Engi- neering 107: 194–201. https://doi.org/10.1016/j.optlaseng.2018.03.029. Li, J., X. Xie, G. Yang, B. Zhang, T. Siebert, and L. Yang. 2017. “Whole- field thickness strain measurement using multiple camera digital image correlation system.” Optics and Lasers in Engineering 90: 19–25. https://doi. org/10.1016/j.optlaseng.2016.09.012. Pan, B., and B. Chen. 2019. “A novel mirror-assisted multi-view digital image correlation for dual-surface shape and deformation measurements of sheet samples.” Optics and Lasers in Engineering 121: 512–20. https://doi. org/10.1016/j.optlaseng.2019.05.016. Pan, B., K. Qian, H. Xie, and A. Asundi. 2009. “Two-dimensional digital image correlation for in-plane displacement and strain measurement: A review.” Measurement Science & Technology 20 (6): 062001. https://doi. org/10.1088/0957-0233/20/6/062001. Peters, W.H., and W.F. Ranson. 1982. “Digital imaging techniques in exper- imental stress analysis.” Optical Engineering (Redondo Beach, Calif.) 21 (3): 427–31. https://doi.org/10.1117/12.7972925. Shinoda, M., and R.J. Bathurst. 2004. “Strain measurement of geogrids using a video-extensometer technique.” Geotechnical Testing Journal 27 (5): 456–63. Strength, C.F. 1979. “Modulus and Properties of Fabric-Reinforced Lami- nates.” Composite Materials: Testing and Design (Fifth Conference), ed. S.W. Tsai, American Society for Testing and Materials, p. 228. Sutton, M.A., J.J. Orteu, and H. Schreier. 2009. Image correlation for shape, motion and deformation measurements: basic concepts, theory and appli- cations. Springer Science & Business Media. Sutton, M.A., W.J. Wolters, W.H. Peters, W.F. Ranson, and S.R. McNeill. 1983. “Determination of displacements using an improved digital correla- tion method.” Image and Vision Computing 1 (3): 133–39. https://doi. org/10.1016/0262-8856(83)90064-1. Wang, Y.H., J.H. Jiang, C. Wanintrudal, C. Du, D. Zhou, L.M. Smith, and L.X. Yang. 2010. “Whole field sheet‐metal tensile test using digital image correlation.” Experimental Techniques 34 (2): 54–59. https://doi.org/10.1111/ j.1747-1567.2009.00483.x. Yamaguchi, I. 1986. “Automatic measurement of in-plane translation by speckle correlation using a linear image sensor.” Journal of Physics. E, Scientific Instruments 19 (11): 944–48. https://doi.org/10.1088/0022- 3735/19/11/014. N O V E M B E R 2 0 2 2 • M AT E R I A L S E V A L U AT I O N 51
ASNT grants non-exclusive, non-transferable license of this material to  .
All rights reserved. © ASNT 2026. To report unauthorized use, contact: customersupport@asnt.org