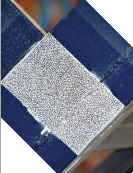
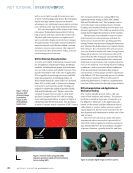
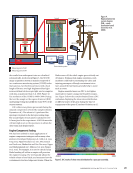
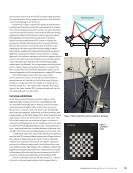
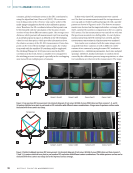
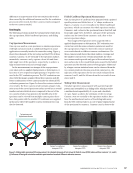
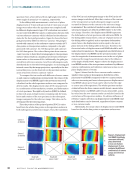
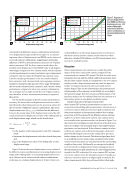
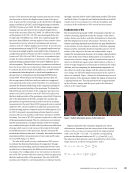
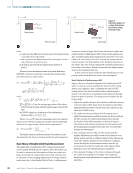
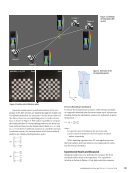
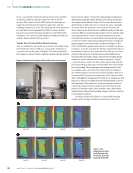
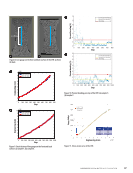
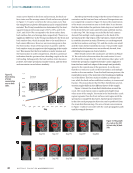
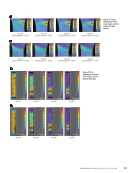
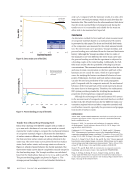
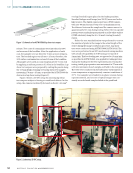
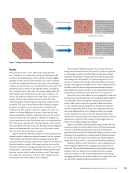
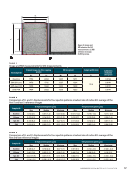
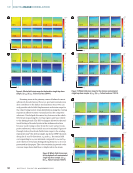
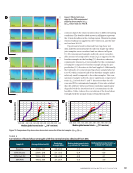
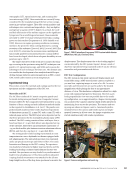
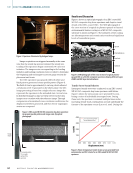
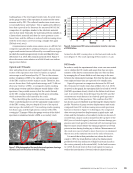
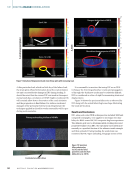
(2750 × 2200 pixels resolution) with f50 lenses were installed on the front and rear tripods to form two sets of 3D-DIC systems. The camera and the MTS tensile test machine are triggered synchronously through the trigger box, and the sampling frequency is 10 Hz. The tensile speed of the specimen is 2 mm/min as recommended by ASTM. A slower stretch- ing speed can ensure that more images are collected for DIC evaluation. Two 7300 lx/m LED lamps provided powerful and uniform illumination for the specimen. Tensile Test of Carbon Fiber Resin Laminate The two samples for the tensile test are both carbon fiber resin (CFR) laminate with a width of 15.02 mm and a thickness of 4.91 mm, cut from the same CFR plate. The front and back of the sample are sprayed with a uniform random speckle pattern before the test. Figure 7 shows the engineering principal strain distribution along the tensile direction at the front and back of the sample under different steps. It can be seen that the strain distributions on both sides are not exactly the same, especially the areas where the strains are concentrated. Therefore, the stress-strain curves drawn based on different surface strain data may also differ. A 25 mm long line gauge is used to indicate engi- neering strain history. Since each measurement point on the front and back surfaces are interrelated, selecting any line gauge on the front surface will automatically generate the correspond- ing line gauge on the back surface, as shown in Figure 8. The front- and back-line gauge strain data of two samples are shown in Figure 9. It can be seen that the ultimate engineering strain of both surfaces is about 0.8%, and most of the data are very close except for the last part. To further represent the difference in the front and back surface strains, the percent bending during tensile test can be obtained according to Equation 7. Figure 10 presents these results. The blue scatter points represent the percent bending at each step, and the yellow line is the average percent bending. The average percent bending results for the two samples were 1.46% and 1.37%, respectively. According to the ASTM standard, once the percent bend is higher than 3%, is recommended to report the average value of the strain on both sides. Although the average percent bend of two samples are less than 3%, it still can be clearly seen that the fluctuation occurs at the beginning of the tensile test, where percentage bending of many steps is greater than 3% and the specimen may be sub- jected to a bending couple. Since samples 1 and 2 had similar strain histories and percent bending, sample 1 data was selected for subsequent analysis. To further analyze the influence of a possible bending couple on the Young’s modulus measurement, the stress- ME | DIGITALIMAGECORRELATION LED light Back 3D-DIC system Specimen Tensile test machine LED light Front 3D-DIC system Figure 6. Experimental setup for double-sided strain measurement. Step 100 Step 200 Step 400 Step 800 Step 100 Step 200 Step 400 Step 800 Figure 7. The progression of strain: (a) on the front side of the CFR (b) on the back side of the CFR. 46 M AT E R I A L S E V A L U AT I O N • N O V E M B E R 2 0 2 2

L = 25 mm Figure 8. Line gauge on the front and back surface of the CFR: (a) front (b) back. 0 –1 0 1 2 3 4 5 6 7 8 9 100 200 300 400 Step 500 600 700 800 900 0 0 1 2 3 4 5 6 7 8 9 10 100 200 300 400 500 Step 600 700 800 900 1000 Front side data Back side data Front side data Back side data x 10 -3 x 10 -3 Figure 9. Strain history of line gauge on the front and back surface: (a) sample 1 (b) sample 2. Step 14 12 10 8 6 4 2 0 0 100 200 300 400 500 600 700 800 Step 10 9 8 7 6 5 4 3 2 1 0 0 100 200 300 400 500 600 700 800 900 1000 Each step percent bending Average percent bending 3% bending Each step percent bending Average percent bending 3% bending Figure 10. Percent bending per step of the CFR: (a) sample 1 (b) sample 2. Engineering strain 300 250 200 150 100 50 0 20 15 10 5 0 –1 0 1 2 3 4 5 6 7 8 9 Front Back side Average Surfacee Young’ss modulususludmo (GPa))aG Frront 33.522 Back Average 33.24 -2 0 2 4 ×10⁻⁴- 2 0 1 1 Fr nt sside i ddata ck si e ddataa A ddataa ’ ( o 3232.9191 A rage x 10 -3 Figure 11. Stress-strain curve of the CFR. N O V E M B E R 2 0 2 2 • M AT E R I A L S E V A L U AT I O N 47 Engineering strain Engineering strain Percent bending (%) Percent bending (%) Stress ((MPa) )
ASNT grants non-exclusive, non-transferable license of this material to  .
All rights reserved. © ASNT 2026. To report unauthorized use, contact: customersupport@asnt.org