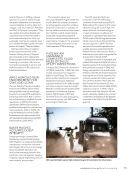
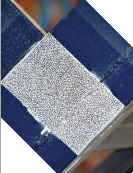
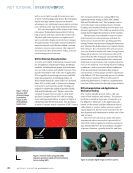
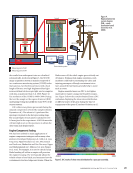
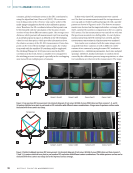
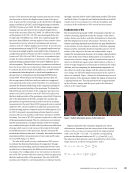
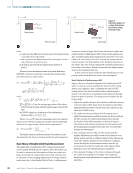
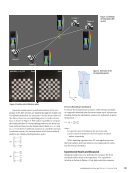
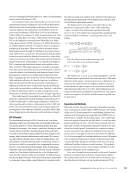
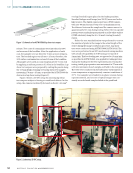
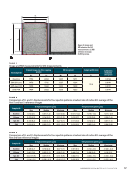
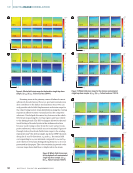
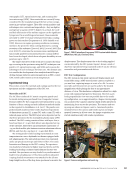
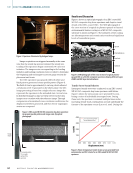
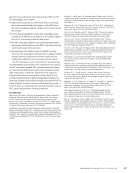
Image acquisition was triggered manually at the same time that the tensile rig operator initiated the tensile test. Loading of the specimen began consistently 10 s after test initiation. The images series corresponding to the loading initiation and loading conclusion were recorded to determine the beginning and end images to process gauge section dis- placement and strain. The CMC specimen was sprayed with both white and black paint to generate a binary speckle pattern (Figure 4). The field of view is approximately 5 cm long, which allowed a resolution of 10.76 µm/pixel on the object plane. The DIC image processing is based on a single reference image that represents the specimen in the unloaded state. Several even- ly distributed images in time are then selected as the data images cross-correlate with the reference image. Through computation of normalized cross-correlation coefficients, the displacement field is generated, and then Green-Lagrangian strains are computed. Results and Discussion Figure 5 shows an optical photograph of an EBC-coated MI SiC/SiC composite dog-bone specimen and depicts visual details of the EBC-coated CMC. The SEM photograph of the cross section of a typical air plasma–sprayed tri-layered environmental barrier coating on a MI SiC/SiC composite substrate is shown in Figure 6. The sublayers of the coating are inhomogeneous and contain microcracks and significant levels of nonuniform pores. Tensile Stress Strain Behavior Interrupted tensile tests were conducted on an EBC-coated MI SiC/SiC composite dog-bone specimen until failure. Figure 6 shows the stress-strain curve generated by com- bining a series of individually interrupted tests. During these tests, the specimen is scanned multiple times under increasing tensile loads, starting from no load until finally the fracture of the specimen occurs (Lau et al. 1996). During the Extensometers Test specimen Figure 3. Specimen illuminated by halogen lamps. Gauge region CT scanned section 13 mm wide center of the specimen Figure 4. EBC-coated MI SiC/SiC composite dog-bone specimen: (a) sprayed speckle pattern and image scale (b) optical photograph. 25 mm 10.65 mm Y X Top coat Intermediate coat Bond coat Substrate Figure 5. SEM photograph of the cross section of a typical plasma- sprayed EBC on a SiC/SiC composite specimen showing different layers of EBC and EBC layer microstructures. Specimen failure 4000 Displacement (mm) Load vs displacement (3400 N) Test case (specimen failure) 3000 2000 1000 0 0.00 0.02 0.04 0.06 0.08 0.10 0.12 0.14 Figure 6. Room temperature tensile strain curves generated from extensometer and DIC strains for an EBC-coated MI SiC/SiC CMC specimen. ME | DIGITALIMAGECORRELATION 64 M AT E R I A L S E V A L U AT I O N • N O V E M B E R 2 0 2 2 Load (N)

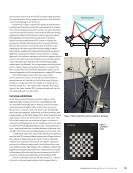
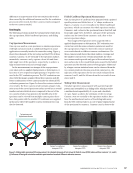
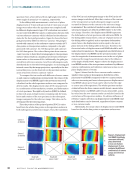
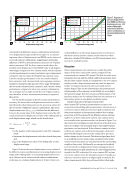
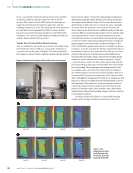
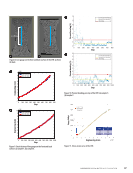
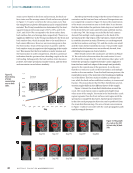
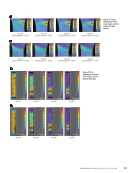
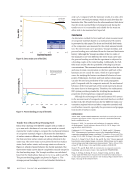
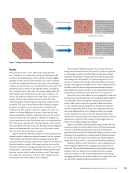
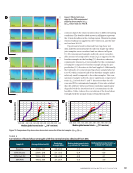
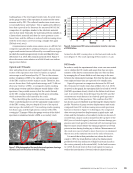
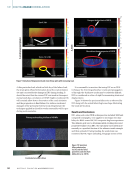
loading phase of the interrupted tensile tests, the axial strain in the gauge section of the specimen is monitored by exten- someter and by DIC. The collated tensile stress-strain curve is essentially linear until failure. This is significantly different from that reported in the literature for uncoated MI SiC/SiC composites of a pedigree similar to the substrate material used in this study. Typically, the materials perform initially as a linear elastic material and then the curve presents a non- linear form, and the stiffness is reduced with increasing stress with the stress-strain curve becoming a straight line again (DiCarlo et al. 2005). A representative tensile stress-strain curve of a MI SiC/SiC composite typically shows a bilinear behavior: a linear elastic region until matrix fracture followed by a second linear region in which the matrix progressively cracks until final fracture (Morscher et al. 2010 McCormick and Lord 2010). Figure 6 shows the stress-strain relation at a 3400 N load case indicat- ing specimen failure. Optical and CT Results After unloading from each interrupted tensile test, the gauge section of the specimen was observed under an optical microscope as well as analyzed by CT. Due to the extreme surface roughness of EBCs, the optical microscope images of the EBC could not resolve surface cracks. Therefore, they are not shown here. Both optical microscopy and CT did not show any evidence of EBC- or composite-matrix cracking at the gauge section until the ultimate tensile failure of the specimen. One possible reason is that the cracks formed in the EBC coating during loading closed upon unloading, which activated the relief caused by the crack. Thus, identifying the cracks becomes more difficult. Other contributing factors are the unusually rough surface of the EBC coating, the poor depth of focus of the optical microscope, the inability of CT in resolving cracks opening less than 4 µm, and the high atomic contrast of the EBC coating in CT images. When the gauge section of the failed specimen is examined under a SEM, a secondary crack formed on the EBC coating close to the fractured end can be seen (Figure 7). The crack opening of this crack is 1 µm. DIC Results In order to verify the experimental data, a test case was carried out to validate the DIC results and assure that they are repre- sentative of the known extensometer data sets. This was done by averaging the 2D strain fields at each time step in the area between the extensometer’s prongs. Note that the data set edges were neglected since they are expected to be visually noisy. Figure 8 represents a comparison between the DIC and the extensometer tensile strain data (Abdul-Aziz et al. 2015). As noted on the graph, the specimen failed at a load of 3700 N (140 MPa specimen stress), which is the failure load/stress case. It is further clear from the figure that the DIC and the extensometer strain data are in relatively good agreement until the failure of the specimen. This confirms that DIC has shown a good reliability in predicting the displacement profile. Variation of gauge section displacement and strain computed from DIC with increasing stress until specimen fracture is shown in Figure 9. In this figure, the computed data sets are pictured as displacement in pixel units, and strain and the formation of secondary cracks can be seen. It is noted that a major crack is initiated in the top layer of the EBC (see red circled region), and more obvious damage pro- gression and crack growth is observed with increasing stress. This becomes clearer where the strain progresses at several points in time during loading up to failure. Measurement of the crack size was very hard to trace however, it is estimated that its size at the initiation site is in the order of microns. It is noted that at this particular test, where the load is equal to 3 KN, the strain field as well as the displacement profile showed clear indication of high local strain (crack in the center, primarily in the strain field). As the load increases to 3.4 KN, the local strain in that crack region increases, as well as the introduction of several other localized strains. Secondary matrix crack Fractured end Figure 7. SEM photographs of the tensile fractured specimen showing a secondary crack on the surface of the EBC coating. 0.08 0.07 0.06 0.05 0.04 0.03 0.02 0.01 0 0 10 20 30 40 50 60 70 Time (s) Figure 8. Comparison of DIC versus extensometer strain for a test case at 3700 N failure. N O V E M B E R 2 0 2 2 • M AT E R I A L S E V A L U AT I O N 65 Tensile strain E xx (%)
ASNT grants non-exclusive, non-transferable license of this material to  .
All rights reserved. © ASNT 2026. To report unauthorized use, contact: customersupport@asnt.org