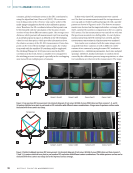
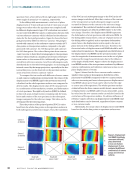
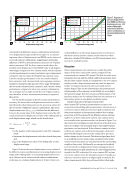
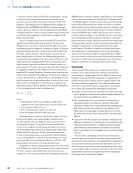
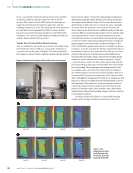
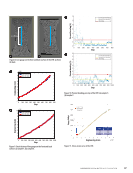
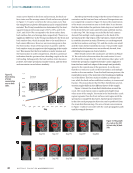
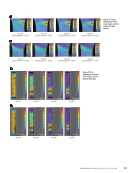
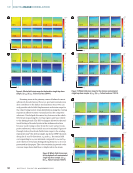
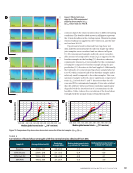
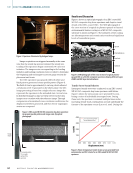
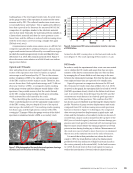
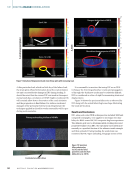
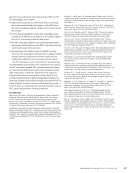
strain curves based on the front surface strain, the back sur- face strain, and the average strain of both surfaces are plotted in Figure 11. It can be seen from the stress-strain curve that the sample has no plastic deformation and is a typical brittle material. The Young’s modulus was determined by the least- squares fitting in the strain range of 0.1%–0.8%, and 33.53, 32.91, and 33.24 GPa correspond to the front surface data, back surface data, and average data, respectively. There is no significant difference in the Young’s modulus for the front and back surface data, which is mainly due to the small front to back strain difference. However, an interesting point is that the front surface strain of the specimen is positive and the back surface strain is negative at the beginning of the tensile test. This means that the front surface is under tension and the back surface is under compression, which is a potential indication that the specimen has a bending couple at the ini- tial loading. Subsequently, the back surface strain becomes positive, the entire specimen is under tension, and the front and rear strain curves behave similarly. Another point worth noting is that the areas of strain con- centration on the front and rear surfaces of the specimen are not completely consistent. Figure 12 shows the strain history of the strain concentration area on both sides. It can be seen that the strain before the previous strain step is not much dif- ferent from the latter strain until the strain suddenly increas- es after step 709. The images recorded by the back camera showed that multiple cracks appeared on the back of the specimen in the edge region of the specimen, which resulted in a sudden increase in strain. However, no cracks appeared on the front surface until step 751, and the cracks were small and the strain did not suddenly increase. One possible expla- nation is that the laminate was not uniformly formed, thus exhibiting heterogeneous characteristics. More details on how the cracks grow are shown in Figure 13. The red circle is the area where the crack exists. It is evi- dent from the images that the crack initiation takes place well before the specimen completely breaks. Cracks originated from the front and back edges of the sample and gradually spread to the central area of the specimen. It can be seen that there is only one crack on the front surface and multiple cracks on the rear surface. From the final fracture pictures, the main failure mode of the material is the breaking and pulling out of the fibers. The front surface exhibits an oblique frac- ture, while the back surface exhibits a tendency to transversal fracture. This may indicate that the fiber distribution and ori- entation angles differ in the different layers of the sample. Figure 14 shows the strain field distribution around the crack. The crack region strain is significantly higher than other areas of the sample. The strain in the back surface crack region is greater than the front surface crack region until the specimen is completely fractured. Another point of interest is that the crack propagation direction can be predicted from the strain distribution map. The area of strain concentration in Figure 14 almost coincides with the crack propagation path until the sample fractures. ME | DIGITALIMAGECORRELATION Step 0.03. 0.025 0.02 0.01 0.005 0 –0.0055 Step 709 Step 7100 Step 751 Step 752 0 100 200 300 400 500 600 700 800 900 Front side Back side p 0 0. 0. 00.015. 0. 1 0. S p 9 S St 1 0 4 0 0 si e ddataa k si e ddatata Figure 12. Strain history of strain concentration area on both sides. Step 752 Step 772 Step 792 Step 819 Step 820 Step 710 Step 745 Step 780 Step 819 Step 820 Figure 13. The growth of a crack on the CFR: (a) front side (b) back side. 48 M AT E R I A L S E V A L U AT I O N • N O V E M B E R 2 0 2 2 Engineering strain

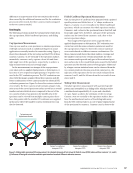
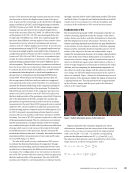
Step 100 Step 200 Step 400 Step 800 Step 100 Step 200 Step 400 Step 800 Figure 15. The progression of strain in the EDDS: (a) front side (b) back side. Step 752 Engineering strain = 0.0151 Step 772 Engineering strain = 0.0161 Step 792 Engineering strain = 0.0182 Step 819 Engineering strain = 0.0222 Step 710 Engineering strain = 0.0229 Step 745 Engineering strain = 0.0262 Step 780 Engineering strain = 0.0286 Step 819 Engineering strain = 0.0331 Figure 14. Strain distribution in the crack region: (a) front surface (b) back surface. N O V E M B E R 2 0 2 2 • M AT E R I A L S E V A L U AT I O N 49
ASNT grants non-exclusive, non-transferable license of this material to  .
All rights reserved. © ASNT 2026. To report unauthorized use, contact: customersupport@asnt.org