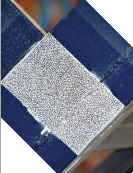
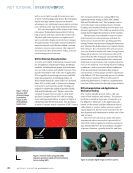
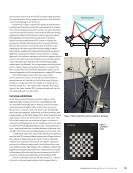
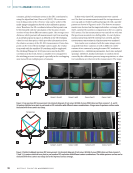
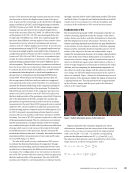
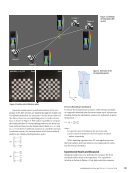
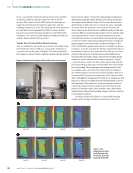
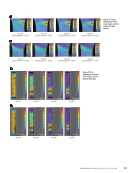
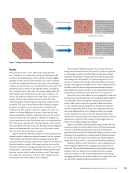
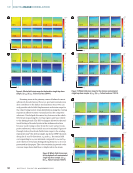
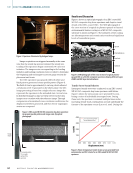
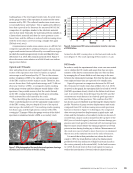
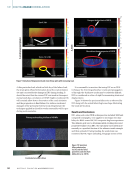
common, global coordinate system in the DIC correlation by using the algorithm from Chen et al. (2013). 3D reconstruc- tion of data points in the reference step can be achieved by multi-image triangulation based on the calibration param- eters. Therefore, the 3D coordinate values of data points can be determined with the calculation of the location of inter- sections of rays from different camera pairs. The average error distance, which prevents all measurement rays from meeting at an identical point in space, is defined as the 3D residuum value for each data point, which provides information about the relative accuracy of the 3D-DIC measurement. If one data point can be viewed from multiple camera pairs, the evalua- tion result with the smallest 3D residuum will be employed. No stitching (Wang et al. 2013) process is used in the DIC correlation in this work hence, a smaller error compared to the stitching process is excepted, especially in the overlapping area viewed from multiple pairs of cameras. In this work, three DIC measurements were carried out. The first two measurements used the test specimens of one cup and one folded cardboard prepared with a speckle pattern as shown in Figures 3 and 4. The first two measure- ments were focused on the improved surface coverage of the three-camera DIC system in comparison to the two-camera DIC system. The last measurement was carried out with one flat specimen mounted on a sliding table. An out-of-plane motion (away from the DIC system) was created, and the measurement uncertainty in displacement was analyzed. Test results were evaluated with the same image series acquired from three cameras as well as different combi- nations of two cameras by using the same DIC evaluation parameters (i.e., calibration parameters, facet size, and grid spacing). Therefore, similar systematic or random errors caused by the calibration process, image acquisition, or other test conditions are inherent in the measurement. The major ME | DIGITALIMAGECORRELATION 2 1 3 Test specimen Camera 1, 2, and 3 Camera 1 and 2 Camera 1 and 3 5.0 4.5 4.0 3.5 3.0 2.5 2.0 1.5 1.0 0.5 0.0 Camera 2 and 3 FOV — camera 1 FOV — camera 2 FOV — camera 3 Figure 4. Folded cardboard specimen DIC measurement: (a) schematic diagram of test setup (b) field of views (FOVs) observed from cameras 1, 2, and 3 (c) contour statistical error plots in µm based on DIC evaluation with different camera combinations. The whole specimen surface can be evaluated with three-camera test setup due to the improved surface coverage. 2 1 3 Test specimen Camera 1, 2, and 3 Camera 1 and 2 Camera 1 and 3 5.0 4.5 4.0 3.5 3.0 2.5 2.0 1.5 1.0 0.5 0.0 Camera 2 and 3 FOV — camera 1 FOV — camera 2 FOV — camera 3 Figure 3. Cup specimen DIC measurement: (a) schematic diagram of test setup (b) field of views (FOVs) observed from cameras 1, 2, and 3 (c) contour statistical error plots in µm based on DIC evaluation with different camera combinations. A larger area of specimen surface can be evaluated with three-camera test setup. 36 M AT E R I A L S E V A L U AT I O N • N O V E M B E R 2 0 2 2

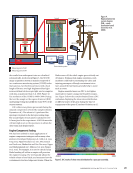
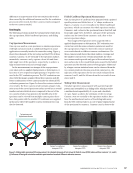
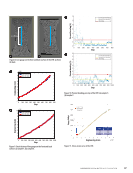
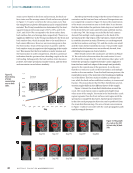
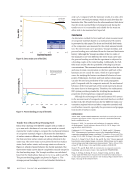
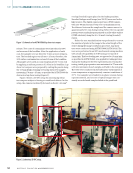
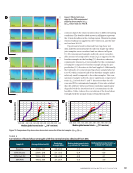
difference or improvement of the test results in this work is then caused by the additional camera used for the evaluation process (in other words, the three-camera results compared to the two-camera results). Test Results The following sections include the measurement results from the cup specimen, folded cardboard specimen, and sliding table. Cup Specimen Measurement One cup was used as a test specimen to simulate specimens with high curvature (such as cylindrical shapes) in actual applications normally involved in materials testing. Figure 3 shows the schematic of the test setup and the FOVs of three cameras. Camera 2 is set vertically to the specimen surface meanwhile, cameras 1 and 3 capture a front-left and front- right angle view of the specimen, respectively, to achieve a large measurement area and coverage angle. In the measurement, two images of the cup specimen were taken with no applied displacement or deformation. A facet size of 23 × 23 pixels and grid spacing of 15 pixels were used in the DIC evaluation process. The DIC evaluation was done with the images acquired from three cameras and dif- ferent combinations of two cameras under the identical DIC evaluation parameters. Figure 3c shows the contour statistical error results. The three-camera result contains a larger evalu- ation area of the curved specimen surface as well as an overall smaller contour statistical error compared to the rest of the two-camera results. Data points in the middle area of the specimen can be viewed from multiple camera pairs there- fore, data points with the smallest 3D residuum were applied in this area, where the smallest contour statistical error can also be detected. Folded Cardboard Specimen Measurement One A4-size piece of cardboard was prepared with a printed speckle pattern and folded into a “w” shape as shown in Figure 4. Camera 2 is set vertically to the folded cardboard specimen, which can measure the whole specimen surface. Cameras 1 and 3 observe the specimen from a front-left and front-right angle view therefore, only part of the specimen surface can be viewed from cameras 1 and 3 due to the uneven specimen shape. Two images of the specimen were acquired with no applied displacement or deformation. DIC evaluation was carried out with the same evaluation parameters used for the cup specimen. Figure 4c shows the contour statistical error results based on different camera combinations. The three-camera result shows the whole surface coverage and the smallest contour error overall meanwhile, the other two-camera results provide only part of the evaluated speci- men surface due to the visual blind spots caused by the folded specimen and the limited camera viewing angles. Additional- ly, a larger contour statistical error can be observed from the two-camera results in the area away from cameras (i.e., the right area of the specimen for the test result evaluated from cameras 1 and 2, and the left area from the test result of cam- eras 2 and 3). Sliding Table Measurement One plate specimen was prepared with a printed speckle pattern and assembled on a sliding table, which provides a unidirectional repeatability of 0.2 µm and a backlash of 2 µm. Figure 5a shows the schematic of the test setup. Camera 2 was set vertically to the specimen surface there- fore, the unidirectional motion of the sliding table away from the DIC system leads to an out-of-plane displacement of the specimen for camera 2. Cameras 1 and 3 observe the 2 1 3 Test specimen and displacement direction Camera 1 as a reference data point: 2135 Camera 2 as a reference data point: 2975 Camera 3 as a reference data point: 2023 FOV — camera 1 FOV — camera 2 FOV — camera 3 Figure 5. Sliding table specimen DIC measurement: (a) schematic diagram of test setup (b) field of views (FOVs) observed from cameras 1, 2, and 3 (c) influence of facet grid orientation and data point number based on different reference cameras. N O V E M B E R 2 0 2 2 • M AT E R I A L S E V A L U AT I O N 37
ASNT grants non-exclusive, non-transferable license of this material to  .
All rights reserved. © ASNT 2026. To report unauthorized use, contact: customersupport@asnt.org