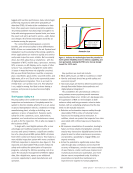
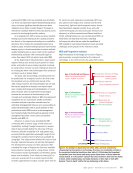
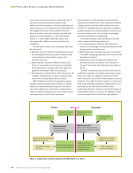
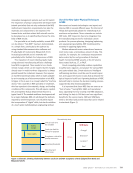
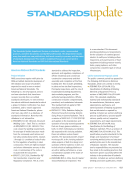
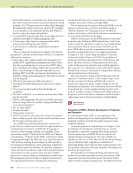
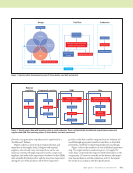
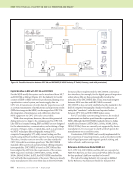
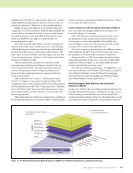
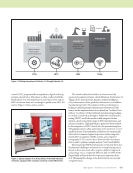
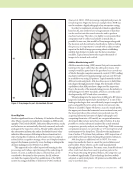
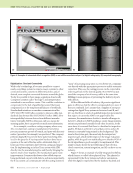
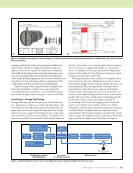
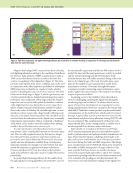
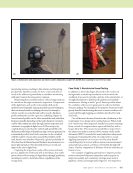
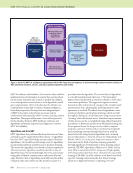
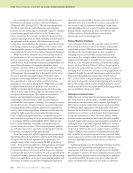
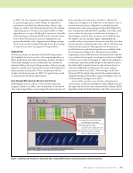
J U L Y 2 0 2 0 • M A T E R I A L S E V A L U A T I O N 875 to NDT 4.0. The transition of algorithms should initially be a phased approach, to both validate the algorithm’s performance and build an understanding of where algo- rithms are reliable and where limitations exist. By tracking called indications over time, it becomes feasible to refine algorithms as necessary. Building that experience internally and achieving an initial payoff will lead to a broader transi- tion of these best practices across an organization and greater shareholder value. Organizational change manage- ment must ease this transition through the proper training of inspectors and also management of expectations. Applications Several case studies are presented in the following sections that highlight these best practices of leveraging algorithms in NDT applications and addressing human-machine interfaces. These early examples can be considered in the context of a minimal viable product, providing a product with just enough features to satisfy early requirements and provide feedback for future product development. These examples provide key insight on both the promise for NDT 4.0 applications as well as opportunities for future improvement. Early Example Where AI Vision Becomes IA in Practice Following the success of the C-141 weep hole inspection program (Aldrin et al. 2001), the development of automated data analysis algorithms was investigated for the inspection of beam cap holes in US Air Force (USAF) C-130 aircraft (Figure 2a) (Lindgren et al. 2005). Here, the fastener sites of interest were in locations of limited accessibility from the external surface and contain fasteners with sealant (Figure 2b). Due to limitations with the NDT capability at the time, there was a need to develop improved ultrasonic techniques to detect fatigue cracks at these locations. A key challenge was the ability to discern multiple signals originating from a possible crack and a geometric feature in a part that was either closely spaced or superimposed in time. The C-130 beam cap holes provided a special challenge given the skewed riser, installed fasteners, and limited transducer accessibility of the B-scan inspection (Figure 2b). This inspection problem frequently produced reflections from the fastener hole (referred to as reradiated insert signals) occurring at similar times of flight (TOF) as near and far crack signals. To address this challenge, a novel feature extraction methodology was developed to detect the relative shift of signals in time for adjacent transducer loca- tions due to differing echo dynamics from cracks and part geometries (Aldrin et al. 2006). This technique was the first ultrasonic NDT method using assisted data analysis methods, validated through a POD study, to inspect for fatigue cracks on USAF structures (Lindgren et al. 2005). A view of the operator’s user interface, dating back to 16 years now, is presented in Figure 3. The original vision for the approach was to have the automated data analysis (ADA) algorithms make all of the indication calls. The team referred –1 = Signal too weak from hole increase gain and rerun –4 = Hole signal cut off expand scan range and rerun RIS = Reradiated insert signals (due to tight fastener fit) Figure 3. Graphical user interface for automated data analysis (ADA) software incorporating neural network classifiers.

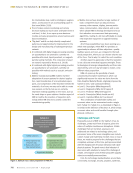
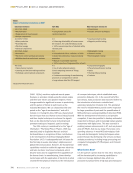
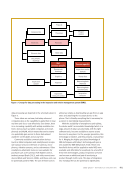
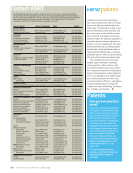
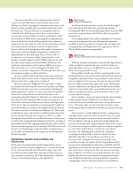
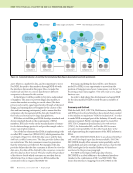
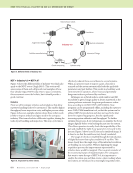
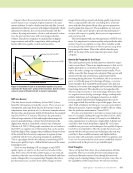
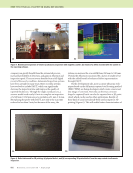
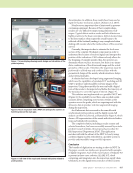
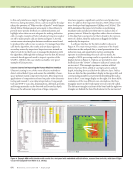
876 M A T E R I A L S E V A L U A T I O N • J U L Y 2 0 2 0 to this early interface as simply “red light/green light.” However, during transition, when a call was made by the algo- rithm, the question of “Why was the call made?” would imme- diately follow. Enhancements were made to the software to provide more specific feedback on called indications and highlight when data was not adequate for making indication calls. A couple examples of hole indications being too weak or cut off to make proper calls are shown in Figure 3. As well, certain severe structure-plus-fastener conditions were found to produce false calls on rare occasions. To manage these false calls by the algorithm, the results and raw data required a secondary review by inspectors. Inspectors were trained on what to look for in the B-scan to manage this limitation with the algorithm. Although this technique was the first AI/neural network–based approach used to inspect a portion of the USAF C-130 fleet, this case study is actually a very good example of IA in practice. Lessons Learned on Improving the Human-Machine Interface Ultrasonic testing is one of the most effective methods to detect critical defect types and ensure the reliability of aero- space polymer matrix composite structures. Most inspection applications of composites are based on pulse-echo ultrasonic testing and manual C-scan data interpretation. Using ampli- tude and TOF C-scan data, delaminations, disbonds, porosity, and foreign materials can be detected and located in depth. However, the ultrasonic inspection of large composite structures requires a significant work force and production time. To address this inspection burden, ADA software tools were developed and implemented (Aldrin et al. 2016a). The ADA minimizes the inspector’s burden on performing mundane tasks and allocates their time to analyze data of primary interest. When the algorithm either detects a feature in the data that is unexpected or that is found to be represen- tative of a defect, then the indication is flagged for further analysis by the inspector. A software interface for the ADA toolkit is shown in Figure 4. The main view provides a summary of the found indications in the analyzed data, a visual presentation of an indication map, and quantitative metrics assisting the operator in understanding why each call was made. An example of ADA processing results is reported in the interface display shown in Figure 4. Options are provided to enter feedback into the “review” column to indicate if certain calls are incorrect. This example specimen contains artificial defects that have been added at varying locations and ply depth, including above and below the adhesive layer. Indica- tions are listed in the spreadsheet display in the upper left, and corresponding numbers are presented identifying the indica- tions in the C-scan image display on the right. For these ADA evaluations of the two different scan orientations, the three triangular inserts in the bond region were all correctly called. The left-most triangle is in front of the bond and the right two triangles are behind the bond. Indications for the six inserted ME TECHNICAL PAPER w ia and human-machine interfaces Bond region indications “Sticky note” indication Figure 4. Example ADA toolkit interface with results for a test panel with embedded artificial defects, scanned from tool side, with time of flight C-scan view (adapted from Aldrin et al. 2016a).
ASNT grants non-exclusive, non-transferable license of this material to  .
All rights reserved. © ASNT 2026. To report unauthorized use, contact: customersupport@asnt.org