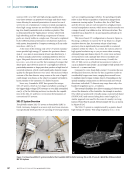
noncontact laser scanner for surface reconstruction. These
geometry scans serve as the ground truth for the different test
objects used in this study and provide the basis for generating
the corresponding shape models needed for calibration algo-
rithms, as well as for comparing results from the structured
light sensor array.
Software for Simultaneous Hardware Control and Data
Analysis
For the fastest combination of data acquisition, trigger control,
and point cloud analysis feedback, all aspects were merged
into a common software interface built on a machine vision
library toolkit. During operation of the structured light sensors,
the control software is linked with the machine vision library,
enabling direct acquisition control and output data formatting
of the sensors. The acquired 3D data is analyzed immediately
after capture within the same software to display results. For
converting CAD geometries from CMM measurements or
shape models into formats compatible with the machine vision
library for shape-comparison analysis, a separate CAD software
tool was used.
Experimental Results and Discussion
In this section, experimental results are presented regarding the
WCS mapping and rapid 3D point cloud meshing from an array
of structured light sensors without requiring any part or sensor
articulation. The results show that the proposed automatic point
cloud statistical quality inspection algorithm can readily detect
when hairpin wire-form geometries exhibit deviations in the
expected 3D surface profile, which are indicative of wear in the
die-forming process. The future work of this research is also
summarized, specifically focusing on strategies to further reduce
the time required to perform a full 3D hairpin quality assess-
ment beyond what has already been achieved in this study.
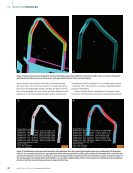
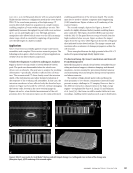
Calibration Point Cloud Analysis for WCS Repeatability
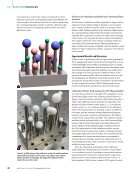
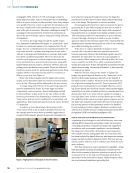
To verify the procedure for repeatable WCS assignment across
all structured light sensors, the calibration artifact shown in
Figure 5 was first measured using the CMM system described
earlier. The CMM was used to measure the diameters of all
spheres and the positional center-point (x, y, z) coordinates
relative to the (0, 0, 0) coordinate defined on the calibration
block. This measurement was repeated 25 times on different
occasions, and the statistical average diameters and sphere
positions were used to generate representative CAD surface
models of the actual artifact assembly. The calibration artifact
was then placed within the field of view of all structured light
sensors, and 3D point cloud data was acquired from each
sensor. Surface model matching using a uniform best fit of
the CAD representation of the calibration artifact was per-
formed for each 3D point cloud, and the resulting positional
and angular alignment were recorded. It was determined that
a minimum of 50 scans from each sensor was required to
provide robust and reliable statistics for minimizing error in
determining the position and orientation of the surface model
within the point cloud data.
Once the orientation and position of the calibration
artifact had been determined in each sensor’s scene relative
to its coordinate system, a coordinate-system transformation
was performed for each sensor that placed the origin at the
position of the 10 mm diameter sphere closest to the (0, 0)
block markings. With the new common WCS applied to each
ME
|
ELECTRICVEHICLES
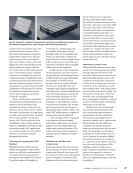
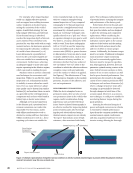
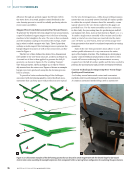
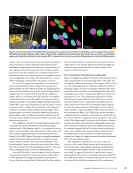
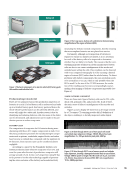
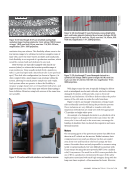
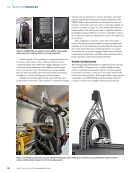
Figure 5. (a) CAD design of the calibration artifact for world coordinate
system (WCS) calibration of the sensor array. Sphere colors denote
sphere diameter in the design (b) image of the physical artifact
created for use in this study.
40
M AT E R I A L S E V A L U AT I O N • J A N U A R Y 2 0 2 6
geometry scans serve as the ground truth for the different test
objects used in this study and provide the basis for generating
the corresponding shape models needed for calibration algo-
rithms, as well as for comparing results from the structured
light sensor array.
Software for Simultaneous Hardware Control and Data
Analysis
For the fastest combination of data acquisition, trigger control,
and point cloud analysis feedback, all aspects were merged
into a common software interface built on a machine vision
library toolkit. During operation of the structured light sensors,
the control software is linked with the machine vision library,
enabling direct acquisition control and output data formatting
of the sensors. The acquired 3D data is analyzed immediately
after capture within the same software to display results. For
converting CAD geometries from CMM measurements or
shape models into formats compatible with the machine vision
library for shape-comparison analysis, a separate CAD software
tool was used.
Experimental Results and Discussion
In this section, experimental results are presented regarding the
WCS mapping and rapid 3D point cloud meshing from an array
of structured light sensors without requiring any part or sensor
articulation. The results show that the proposed automatic point
cloud statistical quality inspection algorithm can readily detect
when hairpin wire-form geometries exhibit deviations in the
expected 3D surface profile, which are indicative of wear in the
die-forming process. The future work of this research is also
summarized, specifically focusing on strategies to further reduce
the time required to perform a full 3D hairpin quality assess-
ment beyond what has already been achieved in this study.
Calibration Point Cloud Analysis for WCS Repeatability
To verify the procedure for repeatable WCS assignment across
all structured light sensors, the calibration artifact shown in
Figure 5 was first measured using the CMM system described
earlier. The CMM was used to measure the diameters of all
spheres and the positional center-point (x, y, z) coordinates
relative to the (0, 0, 0) coordinate defined on the calibration
block. This measurement was repeated 25 times on different
occasions, and the statistical average diameters and sphere
positions were used to generate representative CAD surface
models of the actual artifact assembly. The calibration artifact
was then placed within the field of view of all structured light
sensors, and 3D point cloud data was acquired from each
sensor. Surface model matching using a uniform best fit of
the CAD representation of the calibration artifact was per-
formed for each 3D point cloud, and the resulting positional
and angular alignment were recorded. It was determined that
a minimum of 50 scans from each sensor was required to
provide robust and reliable statistics for minimizing error in
determining the position and orientation of the surface model
within the point cloud data.
Once the orientation and position of the calibration
artifact had been determined in each sensor’s scene relative
to its coordinate system, a coordinate-system transformation
was performed for each sensor that placed the origin at the
position of the 10 mm diameter sphere closest to the (0, 0)
block markings. With the new common WCS applied to each
ME
|
ELECTRICVEHICLES
Figure 5. (a) CAD design of the calibration artifact for world coordinate
system (WCS) calibration of the sensor array. Sphere colors denote
sphere diameter in the design (b) image of the physical artifact
created for use in this study.
40
M AT E R I A L S E V A L U AT I O N • J A N U A R Y 2 0 2 6