radiography (DR), which is 2D. DR technology is ideal for
many inspection tasks, such as weld inspection or identifying
defects in joints, and can provide extremely clear, sharp images
very quickly. However, it does not provide 3D information. For
the more complex task of internal battery inspection, a full 3D
view of the part is necessary. The major challenge in using CT
scanning for the measurement of batteries in production is
speed: the speed of image capture, image processing, and part
manipulation.
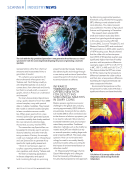
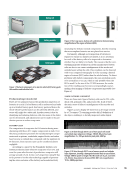
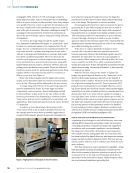
To create a 3D image sharp enough for quality inspec-
tion, hundreds of individual DR images, or “projections,” must
be taken in a rotational manner to be computed into the 3D
image. The rate at which batteries are manufactured allows for
only a few seconds to conduct this inspection if 100% of the
cells are to be inspected. Until about 10 years ago, this would
have been considered impossible. However, driven by the
need for 100% inspection of critical components such as bat-
teries, medical devices, and electrical connectors, along with
improvements in X-ray sources, detectors, software, and com-
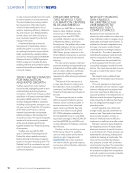
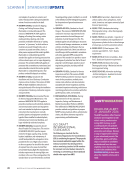
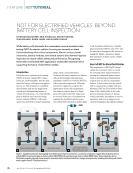
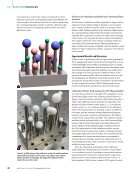
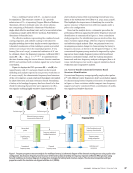
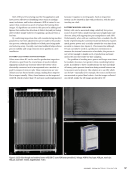
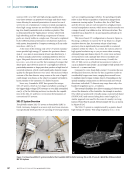
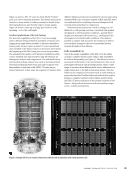
puting power, this has become possible. There are dedicated
machines custom-made for production applications that bring
together all these elements and can achieve CT scans in as
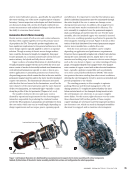
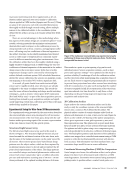
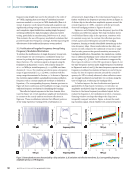
little as 5 s per scan (see Figure 5).
Every one of these images must be inspected to assess
quality, and at this speed, there isn’t time for a human inspec-
tor to do this. This issue will be addressed in the next section.
To image using either DR or CT, the part being inspected
must be penetrated by X-rays. For some large and dense
components—such as motors—this is challenging and will
be discussed later in this article. In the case of battery cells,
however, penetration is less demanding a relatively modest
X-ray source, such as 150 kV, is sufficient for most battery cell
applications. This means that microfocus X-ray can be used for
CT inspection.
To achieve a clear, sharp image, the focal spot of the
X-ray source needs to be as small as possible. However, for
the capture speed to be as short as possible, high power is
required. Unfortunately, physics dictates that the higher the
level of power being put through the source, the larger the
microfocus focal spot size becomes, which reduces the sharp-
ness of the image. This presents an obvious problem.
Several approaches have been taken to increase the power
generating the X-rays while keeping the spot size as small as
possible. One approach replaces the target with a stream of
liquid metal that is constantly recirculating and kept cool [2].
This technology enables the transmission of up to a kilowatt
of power through a focal spot as small as 30 µm. Another
approach replaces the stationary target with a rotating disk that
dissipates heat, thereby reducing the size of the X-ray–emitting
spot while increasing the current [3].
If the aim is to capture hundreds of images in a few
seconds, the X-ray source cannot be switched on and off
between exposures. Instead, the individual captures must be
defined by the equivalent of a shutter in a photographic or
movie camera. When images were collected on film, the X-ray
source would be on all the time, while a mechanical shutter
would open and close. Today, this function is performed by the
digital detector using “chronological shutters” to time-gate the
incoming X-ray signal.
With the detector acting as the shutter to capture the
image, scan speed depends heavily on the “frame rate” of the
detector, while image sharpness depends on the density of
the pixels across its surface. Advances in this area include the
use of photon-counting detectors [4]. Direct-conversion (DC)
pulse photon-counting detectors are highly efficient, convert-
ing X-rays directly into electrical current, which enables higher
sensitivity at low levels of radiation. Photon-counting detectors
also produce little to no noise and are capable of running at
very high frame rates, as fast as 200 fps (frames per second). As
the capability of the source to produce power improves, and as
the frame rate and pixel count of the detector become greater,
the growing amount of data generated needs to be handled
by increasingly powerful computer hardware combined with
software that enables decision-making using automated defect
recognition (ADR) and artificial intelligence (AI).
USE OF ADR AND AI FOR PRODUCTION INSPECTION
Acquisition of good images is only half of the story when con-
sidering RT for inspection and quality control. In aerospace,
a very high proportion of all parts are inspected using RT in
accordance with government regulations, and traditionally,
the images are reviewed by a hierarchy of expert inspectors
who visually examine radiographic film. In recent years, film
has been replaced by digital detectors, with inspectors viewing
images on high-resolution digital monitors. However, per reg-
ulation, neither ADR nor AI is in common use within the aero-
space industry.
Now that advances in source and detector capability—along
with appropriate mechanical handling and computer power—
allow for the scanning of batteries at production speeds as fast
as one part every 5 s, the task of reviewing data must also be
automated. In the automotive industry, unlike aerospace, there
are no government regulations preventing this.
ME
|
ELECTRICVEHICLES
Figure 5. High-speed (5 s CT/analysis) in-line CT machine.
56
M AT E R I A L S E V A L U AT I O N • J A N U A R Y 2 0 2 6
CREDIT:
PINNACLE
X-RAY
SOLUTIONS
many inspection tasks, such as weld inspection or identifying
defects in joints, and can provide extremely clear, sharp images
very quickly. However, it does not provide 3D information. For
the more complex task of internal battery inspection, a full 3D
view of the part is necessary. The major challenge in using CT
scanning for the measurement of batteries in production is
speed: the speed of image capture, image processing, and part
manipulation.
To create a 3D image sharp enough for quality inspec-
tion, hundreds of individual DR images, or “projections,” must
be taken in a rotational manner to be computed into the 3D
image. The rate at which batteries are manufactured allows for
only a few seconds to conduct this inspection if 100% of the
cells are to be inspected. Until about 10 years ago, this would
have been considered impossible. However, driven by the
need for 100% inspection of critical components such as bat-
teries, medical devices, and electrical connectors, along with
improvements in X-ray sources, detectors, software, and com-
puting power, this has become possible. There are dedicated
machines custom-made for production applications that bring
together all these elements and can achieve CT scans in as
little as 5 s per scan (see Figure 5).
Every one of these images must be inspected to assess
quality, and at this speed, there isn’t time for a human inspec-
tor to do this. This issue will be addressed in the next section.
To image using either DR or CT, the part being inspected
must be penetrated by X-rays. For some large and dense
components—such as motors—this is challenging and will
be discussed later in this article. In the case of battery cells,
however, penetration is less demanding a relatively modest
X-ray source, such as 150 kV, is sufficient for most battery cell
applications. This means that microfocus X-ray can be used for
CT inspection.
To achieve a clear, sharp image, the focal spot of the
X-ray source needs to be as small as possible. However, for
the capture speed to be as short as possible, high power is
required. Unfortunately, physics dictates that the higher the
level of power being put through the source, the larger the
microfocus focal spot size becomes, which reduces the sharp-
ness of the image. This presents an obvious problem.
Several approaches have been taken to increase the power
generating the X-rays while keeping the spot size as small as
possible. One approach replaces the target with a stream of
liquid metal that is constantly recirculating and kept cool [2].
This technology enables the transmission of up to a kilowatt
of power through a focal spot as small as 30 µm. Another
approach replaces the stationary target with a rotating disk that
dissipates heat, thereby reducing the size of the X-ray–emitting
spot while increasing the current [3].
If the aim is to capture hundreds of images in a few
seconds, the X-ray source cannot be switched on and off
between exposures. Instead, the individual captures must be
defined by the equivalent of a shutter in a photographic or
movie camera. When images were collected on film, the X-ray
source would be on all the time, while a mechanical shutter
would open and close. Today, this function is performed by the
digital detector using “chronological shutters” to time-gate the
incoming X-ray signal.
With the detector acting as the shutter to capture the
image, scan speed depends heavily on the “frame rate” of the
detector, while image sharpness depends on the density of
the pixels across its surface. Advances in this area include the
use of photon-counting detectors [4]. Direct-conversion (DC)
pulse photon-counting detectors are highly efficient, convert-
ing X-rays directly into electrical current, which enables higher
sensitivity at low levels of radiation. Photon-counting detectors
also produce little to no noise and are capable of running at
very high frame rates, as fast as 200 fps (frames per second). As
the capability of the source to produce power improves, and as
the frame rate and pixel count of the detector become greater,
the growing amount of data generated needs to be handled
by increasingly powerful computer hardware combined with
software that enables decision-making using automated defect
recognition (ADR) and artificial intelligence (AI).
USE OF ADR AND AI FOR PRODUCTION INSPECTION
Acquisition of good images is only half of the story when con-
sidering RT for inspection and quality control. In aerospace,
a very high proportion of all parts are inspected using RT in
accordance with government regulations, and traditionally,
the images are reviewed by a hierarchy of expert inspectors
who visually examine radiographic film. In recent years, film
has been replaced by digital detectors, with inspectors viewing
images on high-resolution digital monitors. However, per reg-
ulation, neither ADR nor AI is in common use within the aero-
space industry.
Now that advances in source and detector capability—along
with appropriate mechanical handling and computer power—
allow for the scanning of batteries at production speeds as fast
as one part every 5 s, the task of reviewing data must also be
automated. In the automotive industry, unlike aerospace, there
are no government regulations preventing this.
ME
|
ELECTRICVEHICLES
Figure 5. High-speed (5 s CT/analysis) in-line CT machine.
56
M AT E R I A L S E V A L U AT I O N • J A N U A R Y 2 0 2 6
CREDIT:
PINNACLE
X-RAY
SOLUTIONS