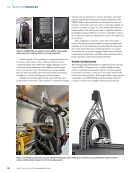
RT remains the only means available to nondestructively test
EV motors for R&D and defect analysis.
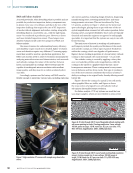
Typically, the features that need to be inspected in both
major components of a motor—the rotor and the stator—are
the copper wire coils, their insulation, and the plastic or epoxy
materials used to hold everything in place. By its very nature,
imaging low-density components buried inside high-density
parts is one of the most difficult challenges in RT, because the
low-density parts experience tremendous scatter artifacts from
the higher-density parts. These artifacts can mask features in
the image and may also lead to false-positive identification of
discontinuities.
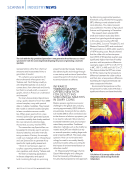
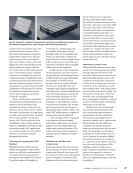
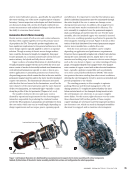
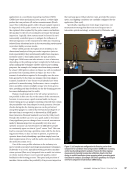
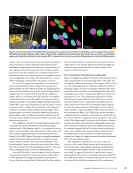
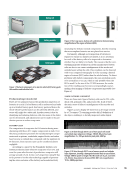
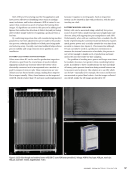
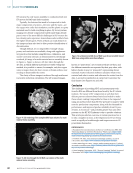
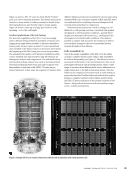
Though difficult, it’s not impossible if enough voltage,
power, and resolution are available, along with supplemen-
tary practices that include using filtration, collimation, and
scatter-correction software, as demonstrated by the sharply
rendered 3D image of a multi-material motor assembly shown
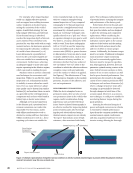
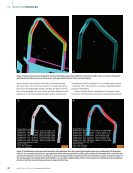
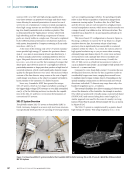
in Figure 14. Figure 15 shows a 2D slice taken through the
3D data, in which different materials are visible. Using this
method, it is possible to extract, for example, only the copper
wires to inspect them for short circuits or breaks without ever
needing to disassemble the motor.
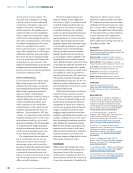
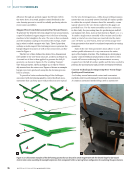
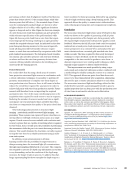
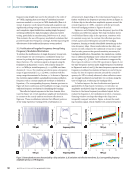
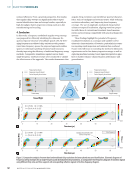
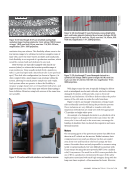
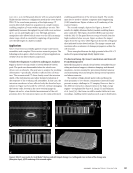
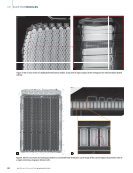
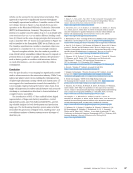
The clarity of these images is achieved through mathemat-
ical scatter-reduction calculations. The 2D scanned images,
known as “projections,” are reconstructed into 3D data, and
the different materials are separated by their gray value, with
lighter shades of gray (or “grayscale”) representing denser
materials. Scatter-reduction software calculates what is true
material and what is scatter and subtracts the scatter from the
data. A second reconstruction is carried out to produce the
final dataset (see Figures 16a and 16b).
Conclusion
The challenges of providing NDT and measurement solu-
tions for EVs are different from those faced by the IC vehicle
industry. The nature of EV components is such that their
delicate parts are almost always buried and sealed to make
them robust, making it impossible for them to be inspected
using any method other than RT. The pressure to improve yield
rates for production components, along with the demand for
performance and improved product reliability from EV pow-
ertrains, is enormous—and probably greater than any other
pressure on the RT NDT industry today to provide solutions.
This article provided an overview of current practices, but it
is only a snapshot in time, as developments in RT are being
made as rapidly as breakthroughs and improvements in EV
powertrains themselves.
REFERENCES
1. Fraunhofer Research Institution for Battery Cell Production FFB. 2024.
“Mastering Ramp-up of Battery Production.” White paper. https://www.
ffb.fraunhofer.de/en/publications/White_papers_environment_reports_
studies/Mastering_Ramp-up_of_Battery_Production.html.
2. Excillum AB. 2025. “The metal-jet technology” [online]. Accessed
5 December 2025. https://www.excillum.com/products/metaljet/.
3. Nikon Metrology Inc. 2025. “Unique 225kV Rotating.Target 2.0" [online].
Accessed 5 December 2025. https://industry.nikon.com/en-us/products/x-
ray-ct/x-ray-source-technology/.
4. Varex Imaging Corporation. 2025. “Photon Counting" [online]. Accessed
5 December 2025. https://www.vareximaging.com/photon-counting/.
ME
|
ELECTRICVEHICLES
Figure 14. 3D rendering of the complete MeV scan volume of a multi-
material motor assembly.
Figure 15. 2D slice through the 3D MeV scan volume of the multi-
material motor assembly.
Figure 16. (a) Uncorrected 2D slice of MeV scan (b) corrected 2D slice of
MeV scan, using scatter-correction software.
60
M AT E R I A L S E V A L U AT I O N • J A N U A R Y 2 0 2 6
CREDIT:
VAREX
IMAGING
CREDIT:
VAREX
IMAGING
CREDIT:
VAREX
IMAGING
EV motors for R&D and defect analysis.
Typically, the features that need to be inspected in both
major components of a motor—the rotor and the stator—are
the copper wire coils, their insulation, and the plastic or epoxy
materials used to hold everything in place. By its very nature,
imaging low-density components buried inside high-density
parts is one of the most difficult challenges in RT, because the
low-density parts experience tremendous scatter artifacts from
the higher-density parts. These artifacts can mask features in
the image and may also lead to false-positive identification of
discontinuities.
Though difficult, it’s not impossible if enough voltage,
power, and resolution are available, along with supplemen-
tary practices that include using filtration, collimation, and
scatter-correction software, as demonstrated by the sharply
rendered 3D image of a multi-material motor assembly shown
in Figure 14. Figure 15 shows a 2D slice taken through the
3D data, in which different materials are visible. Using this
method, it is possible to extract, for example, only the copper
wires to inspect them for short circuits or breaks without ever
needing to disassemble the motor.
The clarity of these images is achieved through mathemat-
ical scatter-reduction calculations. The 2D scanned images,
known as “projections,” are reconstructed into 3D data, and
the different materials are separated by their gray value, with
lighter shades of gray (or “grayscale”) representing denser
materials. Scatter-reduction software calculates what is true
material and what is scatter and subtracts the scatter from the
data. A second reconstruction is carried out to produce the
final dataset (see Figures 16a and 16b).
Conclusion
The challenges of providing NDT and measurement solu-
tions for EVs are different from those faced by the IC vehicle
industry. The nature of EV components is such that their
delicate parts are almost always buried and sealed to make
them robust, making it impossible for them to be inspected
using any method other than RT. The pressure to improve yield
rates for production components, along with the demand for
performance and improved product reliability from EV pow-
ertrains, is enormous—and probably greater than any other
pressure on the RT NDT industry today to provide solutions.
This article provided an overview of current practices, but it
is only a snapshot in time, as developments in RT are being
made as rapidly as breakthroughs and improvements in EV
powertrains themselves.
REFERENCES
1. Fraunhofer Research Institution for Battery Cell Production FFB. 2024.
“Mastering Ramp-up of Battery Production.” White paper. https://www.
ffb.fraunhofer.de/en/publications/White_papers_environment_reports_
studies/Mastering_Ramp-up_of_Battery_Production.html.
2. Excillum AB. 2025. “The metal-jet technology” [online]. Accessed
5 December 2025. https://www.excillum.com/products/metaljet/.
3. Nikon Metrology Inc. 2025. “Unique 225kV Rotating.Target 2.0" [online].
Accessed 5 December 2025. https://industry.nikon.com/en-us/products/x-
ray-ct/x-ray-source-technology/.
4. Varex Imaging Corporation. 2025. “Photon Counting" [online]. Accessed
5 December 2025. https://www.vareximaging.com/photon-counting/.
ME
|
ELECTRICVEHICLES
Figure 14. 3D rendering of the complete MeV scan volume of a multi-
material motor assembly.
Figure 15. 2D slice through the 3D MeV scan volume of the multi-
material motor assembly.
Figure 16. (a) Uncorrected 2D slice of MeV scan (b) corrected 2D slice of
MeV scan, using scatter-correction software.
60
M AT E R I A L S E V A L U AT I O N • J A N U A R Y 2 0 2 6
CREDIT:
VAREX
IMAGING
CREDIT:
VAREX
IMAGING
CREDIT:
VAREX
IMAGING