R&D and Failure Analysis
As noted previously, when describing what is possible and not
possible for production inspection, battery components are,
in almost every case, very delicate, and that is the root of the
inspection challenge that requires the use of RT. Inspection
of anode/cathode alignment and surface overlap, along with
identifying flaws in connectivity, can—with the right equip-
ment—be conducted at production pace. However, a closer
and more detailed inspection cannot. These longer, more
detailed evaluations fall under the categories of R&D and
failure analysis.
The areas of interest for understanding battery efficiency
and durability require much more detailed, higher-resolution
scans and therefore require very different CT scanning equip-
ment than would be used in a production application. For
R&D, such systems need to achieve resolutions meaningful for
analyzing material structure and characteristics, such as anode
and cathode coatings, the nature of the interface between
layers, and anomalies in coatings. These systems must be
capable of reaching sub-micron resolution with excellent
image quality, and they must do so within a relatively short
scan time.
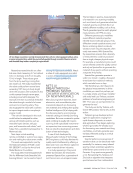
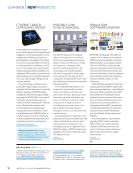
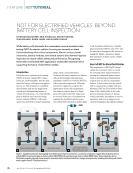
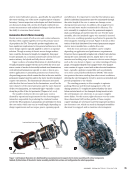
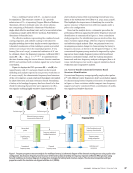
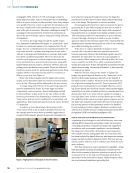
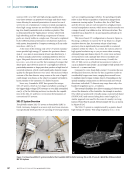
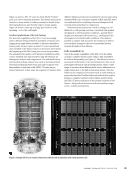
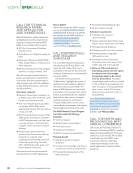
Accordingly, systems used for battery cell R&D must be
flexible enough to undertake various tasks, including exploring
sub-micron particles, evaluating design deviations, diagnosing
manufacturing issues, assessing material flaws, and exam-
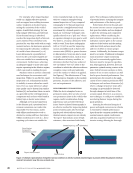
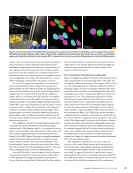
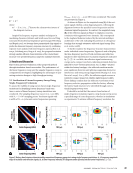
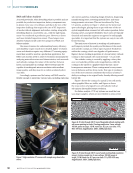
ining geometric structures. This can be achieved by X-ray
CT systems, as shown in Figure 7, which use the latest focal
spot technologies, placing them on par with state-of-the-art
optical magnification scanners but with easier operation, faster
learning curves, and greater flexibility. Since users are typically
chemical and materials engineers as opposed to radiography
specialists, it is important that the systems are easy to use with
limited training.
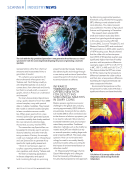
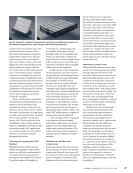
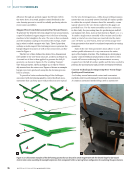
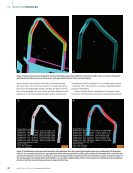
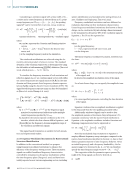
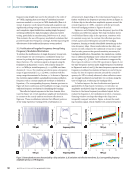
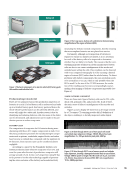
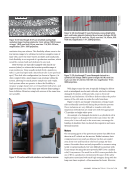
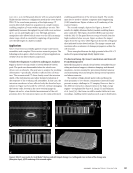
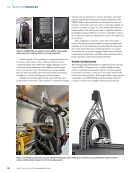
The main areas of interest in studying cell performance
and longevity include the quality and thickness of the anode
and cathode coatings, as well as signs of particle breakdown
within the coatings, which can degrade cell performance.
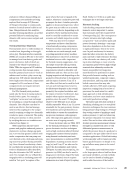
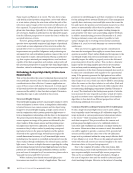
Figure 8 shows cracking in particles of a Li-ion battery cathode
coating in this example, the cracks measure ~0.6 µm wide.
The cathode coating is created by applying a slurry that,
once set, looks like pebbles under magnification, while the
coating on the anode is a graphite slurry that has a more
homogeneous structure. These coatings must be very consis-
tent in thickness and free from cracks. This type of cracking is
one of the most common conditions that reduces a battery’s
ability to recharge to its original levels, thereby affecting overall
battery life.
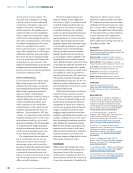
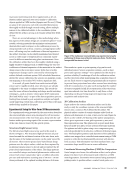
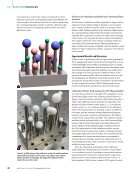
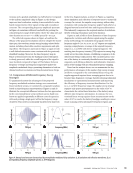
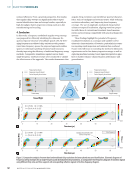
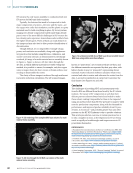
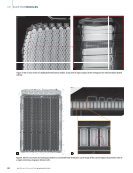
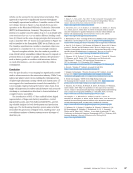
Figure 9 shows the coating of a typical Li-ion cell anode,
where graphite flakes are visible, and Figure 10 shows
the cross section of a typical Li-ion cell cathode, both at
sub-micron discernible feature resolution.
For failure analysis, CT X-ray systems are used that can
scan larger samples, which are more flexible in terms of the
ME
|
ELECTRICVEHICLES
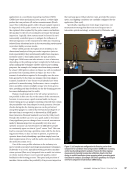
Figure 7. High-resolution CT scanner with sample very close to the
source.
0.04 mm
Figure 8. 2D slice through 3D CT scan of degraded cathode coating (with
red arrows pointing to cracks). Coating sample size: 3 mm voltage:
100 kV power at target: 1.8 W voxel size: 0.5 µm scan time: 11 h
FDD: 459 mm magnification: 200 × 3600 projections.
0.04 mm
Figure 9. 2D slice through 3D CT scan of anode coating (high-resolution
image). Coating sample size: 3 mm voltage: 100 kV power at
target: 1.8 W voxel size: 0.5 µm scan time: 11 h FDD: 459 mm
magnification: 200 × 3600 projections.
58
M AT E R I A L S E V A L U AT I O N • J A N U A R Y 2 0 2 6
CREDIT:
WAYGATE
TECHNOLOGIES
CREDIT:
WAYGATE
TECHNOLOGIES
CREDIT:
WAYGATE
TECHNOLOGIES
As noted previously, when describing what is possible and not
possible for production inspection, battery components are,
in almost every case, very delicate, and that is the root of the
inspection challenge that requires the use of RT. Inspection
of anode/cathode alignment and surface overlap, along with
identifying flaws in connectivity, can—with the right equip-
ment—be conducted at production pace. However, a closer
and more detailed inspection cannot. These longer, more
detailed evaluations fall under the categories of R&D and
failure analysis.
The areas of interest for understanding battery efficiency
and durability require much more detailed, higher-resolution
scans and therefore require very different CT scanning equip-
ment than would be used in a production application. For
R&D, such systems need to achieve resolutions meaningful for
analyzing material structure and characteristics, such as anode
and cathode coatings, the nature of the interface between
layers, and anomalies in coatings. These systems must be
capable of reaching sub-micron resolution with excellent
image quality, and they must do so within a relatively short
scan time.
Accordingly, systems used for battery cell R&D must be
flexible enough to undertake various tasks, including exploring
sub-micron particles, evaluating design deviations, diagnosing
manufacturing issues, assessing material flaws, and exam-
ining geometric structures. This can be achieved by X-ray
CT systems, as shown in Figure 7, which use the latest focal
spot technologies, placing them on par with state-of-the-art
optical magnification scanners but with easier operation, faster
learning curves, and greater flexibility. Since users are typically
chemical and materials engineers as opposed to radiography
specialists, it is important that the systems are easy to use with
limited training.
The main areas of interest in studying cell performance
and longevity include the quality and thickness of the anode
and cathode coatings, as well as signs of particle breakdown
within the coatings, which can degrade cell performance.
Figure 8 shows cracking in particles of a Li-ion battery cathode
coating in this example, the cracks measure ~0.6 µm wide.
The cathode coating is created by applying a slurry that,
once set, looks like pebbles under magnification, while the
coating on the anode is a graphite slurry that has a more
homogeneous structure. These coatings must be very consis-
tent in thickness and free from cracks. This type of cracking is
one of the most common conditions that reduces a battery’s
ability to recharge to its original levels, thereby affecting overall
battery life.
Figure 9 shows the coating of a typical Li-ion cell anode,
where graphite flakes are visible, and Figure 10 shows
the cross section of a typical Li-ion cell cathode, both at
sub-micron discernible feature resolution.
For failure analysis, CT X-ray systems are used that can
scan larger samples, which are more flexible in terms of the
ME
|
ELECTRICVEHICLES
Figure 7. High-resolution CT scanner with sample very close to the
source.
0.04 mm
Figure 8. 2D slice through 3D CT scan of degraded cathode coating (with
red arrows pointing to cracks). Coating sample size: 3 mm voltage:
100 kV power at target: 1.8 W voxel size: 0.5 µm scan time: 11 h
FDD: 459 mm magnification: 200 × 3600 projections.
0.04 mm
Figure 9. 2D slice through 3D CT scan of anode coating (high-resolution
image). Coating sample size: 3 mm voltage: 100 kV power at
target: 1.8 W voxel size: 0.5 µm scan time: 11 h FDD: 459 mm
magnification: 200 × 3600 projections.
58
M AT E R I A L S E V A L U AT I O N • J A N U A R Y 2 0 2 6
CREDIT:
WAYGATE
TECHNOLOGIES
CREDIT:
WAYGATE
TECHNOLOGIES
CREDIT:
WAYGATE
TECHNOLOGIES