against newly acquired point cloud data of hairpins having
the same shape. The total time required to acquire data from
four of the structured light sensors, transfer the data to the PC,
fuse and subsample the point clouds, perform uniform best-fit
alignment to the gold-standard hairpin model, and generate
visualization results averaged 4.8 s—a notable improvement
compared with CMM systems or systems requiring multiple
points of articulation.
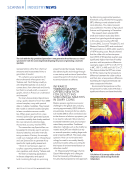
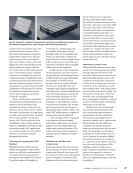
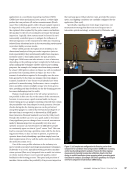
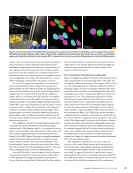
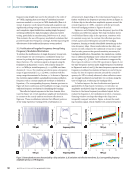
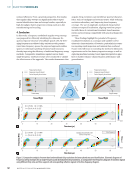
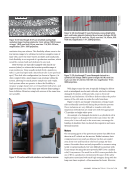
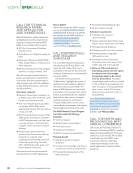
Figure 8 shows typical visualizations of measured wire-
form point cloud deviations from the nominal gold-standard
ME
|
ELECTRICVEHICLES
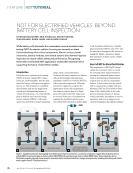
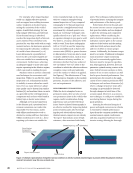
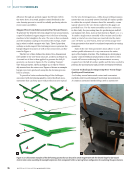
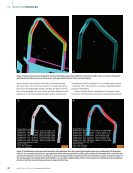
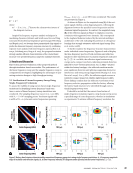
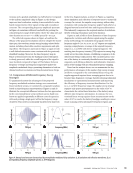
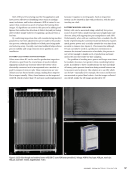
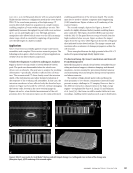
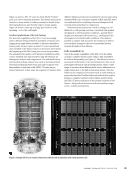
Figure 7. (a) Raw wire-form point clouds from the structured light sensors after calibration to the common WCS. Colors are used to distinguish
point clouds from different sensors (b) final wire-form point cloud after data fusion and subsampling.
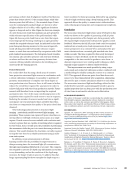
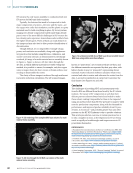
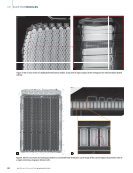
Figure 8. Visualizations of measured wire-form point cloud deviations from the nominal gold-standard part using a uniform best-fit alignment
method: (a) an example maintaining an apex geometry within tolerance specifications of the gold standard (b) an example from a wire-form that
experienced improper die forming, resulting in an apex geometry outside the required tolerance band. Red denotes points that deviate above (+)
the nominal shape, blue denotes points that fall below (–), and white or lighter shades of red or blue indicate near-nominal geometry. Significant
deviations from the nominal shape are shown in deep red and/or blue.
42
M AT E R I A L S E V A L U AT I O N J A N U A R Y 2 0 2 6
part using a uniform best-fit alignment method. Red denotes
points that deviate above (+)the nominal shape, while blue
denotes points that fall below (–) the nominal shape. Points
near the nominal gold-standard shape are shown in white
or lighter shades of red or blue, while significant deviations
appear as deep red and/or blue. Figure 8a shows an example
of a wire-form point cloud that maintains an apex geometry
within tolerance specifications of the gold standard, while
Figure 8b shows a point cloud from a wire-form that experi-
enced improper die forming, resulting in an apex geometry
outside the required tolerance band. As indicated by the data-
point histogram binning statistics for the case in Figure 8b,
nearly all data points fall well outside tolerance require-
ments—a result that was confirmed by comparison with CMM
gold-standard measurements. The histogram-based visualiza-
tion strategy also provides operators with real-time feedback
on where and how the wire-form geometry deviates from
nominal, offering valuable information for identifying root
causes in the die-forming process.
Future Research
The results show that by using a fixed array of sensitive
laser-projection structured light sensors in combination with
a robust calibration technique, it is possible to perform 3D
geometry measurements of complex wire-form shapes at
near-production rates. However, there is still room to further
reduce the overall time required for assessment in order to
achieve full parity with wire-form production speeds. Future
research will therefore focus on improving the required
assessment time. One of the main contributing factors is the
acquisition time required for each sensor to run in sequence.
Reducing the number of sensors needed can have a signifi-
cant impact on total assessment time, provided this reduc-
tion does not compromise the quality of the point cloud data
obtained.
New technology advancements in structured light
imaging—particularly parallel structured light imaging—are
promising. These systems can capture 3D point cloud data on
moving objects with high resolution and accuracy in a single
capture. If such sensors become available with resolution and
accuracy options that are capable of matching what is required
for wire-forms, then it would open the possibility of performing
the assessment while the part is in transit between production
stations. This would eliminate the downtime currently required
to stop the wire-form for a reliable assessment using a multi-
scan static system.
In addition, recent advancements in AI deep
learning models offer the possibility for improvements in
data-processing times for structured light 3D reconstructions
through supersampling (Melichercik et al. 2023). The computa-
tion required to process 3D depth map information in real time
is very demanding, and as the resolution of the depth map
increases, the longer it takes to process. To address this chal-
lenge, supersampling first down-samples the depth map to a
lower resolution for faster processing, followed by up-sampling
it back to high resolution using a deep learning model. This
approach allows the quality to remain intact while simultane-
ously reducing processing time and computational complexity.
Conclusion
The noncontact structured light sensor array developed in this
study was shown to be capable of generating a full 3D point
cloud representation of the hairpin wire-form geometry with
the required tight measurement tolerances for quality-control
feedback. Moreover, the full 3D point cloud could be acquired,
rendered into a fused point cloud representation from all
sensor perspectives in a common WCS, and analyzed for geo-
metric deviations from a nominal gold-standard wire-form
within seconds. The time required for this newly developed
technique to report feedback on the die-forming process is
comparable to the time needed to produce a wire-form—a
dramatic improvement over existing audit techniques, which
typically require minutes to deliver reliable feedback.
This improvement was made possible by using a rigor-
ously tested and verified 3D calibration artifact combined with
a methodology for reliably uniting the sensors to a common
WCS. This approach allows raw point cloud data from each
sensor to be fused immediately after acquisition, eliminating
the need for part or sensor articulation relative to each other.
The noncontact structured light methodology utilized in this
study therefore provides a promising path toward in-process
quality inspection that can keep pace with the production rates
of wire-forms in automotive electric motor fabrication.
ACKNOWLEDGMENTS
The author of this paper would like to acknowledge the valuable input
from Ronald Lesperance regarding the software framework considered
in this study, as well as the assistance provided by John Agapiou, Mark
Muczynski, John Campbell, and Timothy Wilson in CMM testing verifica-
tion on calibration artifacts and select production-relevant components.
REFERENCES
Agapiou, J. S., and H. Du. 2007. “Assuring the Day-to-Day Accuracy of
Coordinate Measuring Machines—A Comparison of Tools and Proce-
dures.” Journal of Manufacturing Processes 9 (2): 109–20. https://doi.
org/10.1016/S1526-6125(07)70112-3.
American National Standard. 2001. ASME B89.7.3.1: Guidelines for decision
rules: considering measurement uncertainty in determining conformance to
specifications. ISBN 978-0-79182-742-9.
American Society for Quality Control. 2003. Measurement Systems Analysis:
Reference Manual, 3rd edition. ISBN 978-1-80534-082-1.
Antolin-Urbaneja, J. C., R. P. Goni, N. A. Olaizola, and A. I. L. Pizarro.
2024. “Robotized 3D Scanning and Alignment Method for Dimensional
Qualification of Big Parts Printed by Material Extrusion.” Robotics (Basel,
Switzerland) 13 (12): 175. https://doi.org/10.3390/robotics13120175.
Baleani, A., P. Castellini, P. Chiariotti, N. Paone, D. Roccetti, L. Zampetti,
M. Zannini, and S. Zitti. 2021. “Dimensional measurements in production
line: a comparison between a custom-made telecentric optical profilo-
meter and on-the-market measurement systems.” 2021 IEEE International
Workshop on Metrology for Industry 4.0 &IoT (MetroInd4.0&IoT): 693–698.
https://doi.org/10.1109/MetroInd4.0IoT51437.2021.9488428.
J A N U A R Y 2 0 2 6 M AT E R I A L S E V A L U AT I O N 43
Previous Page Next Page