of flight, amplitude decay) (Hsieh et al. 2015 Fordham et al.
2023) and frequency-domain signatures (e.g., resonance shifts,
spectral energy redistribution) (Chang and Steingart 2021 Sun et
al. 2022 Ren et al. 2025a) have been used to correlate ultrasonic
responses with mechanical and electrochemical changes in
battery components.
A defining feature of wave–battery interactions is their
pronounced dependence on frequency (Copley et al. 2021
Huang et al. 2022 Ren et al. 2025a), which critically affects the
interpretation of complex signal patterns arising from coupled
structural and electrochemical phenomena in multilayer cells
(Sun et al. 2022 Reichmann and Sharif-Khodaei 2023). Early
studies observed this dependence empirically, reporting that
different excitation frequencies led to varying characterization
performance (Copley et al. 2021 Sun et al. 2022 Reichmann
and Sharif-Khodaei 2023). Subsequent investigations identified
underlying physics such as ultrasonic resonance (Huang et
al. 2022, 2023) and Bragg bandgaps (Ma et al. 2024 Lee et al.
2025), where reflection intensities varied across different fre-
quency intervals. This understanding has since been extended
into a generalized analysis framework (Ren et al. 2025a, 2025b),
revealing structured frequency responses that encode the inter-
play between wave propagation, cell architecture, and electro-
chemical states. These spectral structures serve as physically
meaningful fingerprints of the internal battery configuration
and are highly relevant for state-dependent analysis (Ren et
al. 2025a). However, extracting such frequency structures from
reflection signals in an efficient manner remains a technical
challenge, especially when constrained by testing time, data
volume, and real-time evaluation requirements.
Conventional approaches to ultrasonic band structure iden-
tification rely on sequential narrow-band excitations, typically
toneburst pulses, sweeping across discrete center frequencies
within the range of interest (Huang et al. 2022 Ren et al. 2023,
2025a). While this method enables effective mapping of the
frequency-dependent reflection response, it is inherently inef-
ficient, particularly when wide spectral coverage is required.
Additionally, narrow-band excitations often yield redundant
or uninformative measurements outside the sensitive fre-
quency range, reducing data storage compactness. Frequency-
modulated excitations, such as linear chirps, present a promising
alternative: by encoding a continuous range of frequencies within
a single waveform, they allow for time-compressed and spectrally
broad probing (Yang et al. 2019 Tian et al. 2024 Challinor and
Cegla 2024). However, the design and implementation of such
excitations—particularly in terms of sweep format, signal shaping,
and time-frequency characteristics—remain underexplored in the
context of ultrasonic evaluation of batteries.
In this study, we propose a frequency-modulated
angular-sweep excitation strategy for efficiently identifying the
ultrasonic frequency response structure of multilayer pouch cells.
Simulation studies are conducted to compare the performance of
toneburst-based linear sweeps with frequency-modulated chirp
signals configured at various time-frequency angles. By analyzing
the resulting spectral morphologies and reflection waveforms, we
demonstrate that angular chirp excitations can achieve a sparse
yet informative description of the battery’s critical band structure,
effectively reducing measurement redundancy and enhancing
information density. We further incorporate amplitude modula-
tion to improve time localization, thereby aligning the waveform
characteristics with those of traditional pulse-echo measure-
ments and improving suitability for real-world diagnostics.
The remainder of this paper is organized as follows:
Section 2 presents the method for identifying frequency struc-
tures using both narrow-band and frequency-modulated ultra-
sonic excitations. Section 3 reports the simulation results and
comparative analyses between linear and angular sweep strate-
gies, including their time-frequency behavior and characteriza-
tion performance. Section 4 summarizes the main findings and
outlines the potential of the proposed approach for practical
deployment in ultrasonic battery characterization systems.
2. Methodology
This section presents a detailed formalization of ultrasonic
frequency-response structure identification for multilayer
batteries, enabling efficient and noninvasive characteriza-
tion of their critical band structures through excitation design
and wave analytics. Based on our previous work (Ren et al.
2025a, 2025b), the principle of ultrasonic frequency response
analysis is briefly outlined. Two comparative strategies are
then introduced for frequency structure identification, using
single-frequency narrow-band tonebursts and frequency-
modulated broadband chirps, respectively. Implementation
details are clearly stated to facilitate simulation-based verifica-
tion and comparison in both the time and frequency domains.
2.1. Frequency Response Structure Analysis of
Multilayer Batteries
Commercial pouch cells exhibit a multilayer internal architec-
ture, making their physical dynamics (Hsieh et al. 2015 Chang
and Steingart 2021 Fordham et al. 2023 Wasylowski et al.
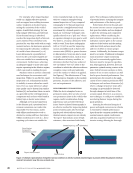
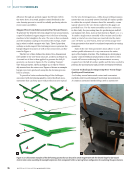
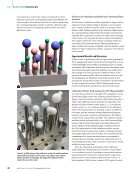
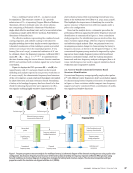
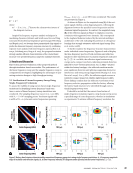
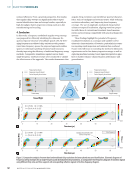
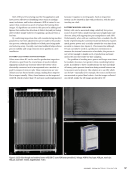
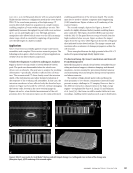
2024) nondestructively identifiable using ultrasound. As illus-
trated in Figure 1a, the frequency response analysis of batteries
can be achieved via a pulse-echo setup by stimulating cells
with tailored probing waves and analyzing the dynamics of
the reflection waves resulting from wave–battery interactions.
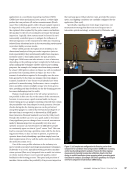
Considering an M -layer pouch cell excited by an N S -point exci-
tation signal s t =[s t [0], ⋯ ,s t [N s − 1]]T, the ultrasonic responses
can be expressed as (Ren et al. 2025a):
(1) R t =ℋ (s t )=IDFT[H] ⊛ s t
where
R t =[r 0 ,⋯ ,r M+1] ∈ ℂ N s × (M+1) denotes the column-wise
response signal matrix for the layer interfaces {z 0 ,⋯ ,z M }
along the battery thickness, and
the reflection signal at the transducer side z 0 is given by r t =r 0.
The dynamic process of wave–battery interactions can be
conceptually represented by the system response function
ℋ :ℂ N c → ℂ N s × (M+1) .
ME
|
ELECTRICVEHICLES
46
M AT E R I A L S E V A L U AT I O N • J A N U A R Y 2 0 2 6
2023) and frequency-domain signatures (e.g., resonance shifts,
spectral energy redistribution) (Chang and Steingart 2021 Sun et
al. 2022 Ren et al. 2025a) have been used to correlate ultrasonic
responses with mechanical and electrochemical changes in
battery components.
A defining feature of wave–battery interactions is their
pronounced dependence on frequency (Copley et al. 2021
Huang et al. 2022 Ren et al. 2025a), which critically affects the
interpretation of complex signal patterns arising from coupled
structural and electrochemical phenomena in multilayer cells
(Sun et al. 2022 Reichmann and Sharif-Khodaei 2023). Early
studies observed this dependence empirically, reporting that
different excitation frequencies led to varying characterization
performance (Copley et al. 2021 Sun et al. 2022 Reichmann
and Sharif-Khodaei 2023). Subsequent investigations identified
underlying physics such as ultrasonic resonance (Huang et
al. 2022, 2023) and Bragg bandgaps (Ma et al. 2024 Lee et al.
2025), where reflection intensities varied across different fre-
quency intervals. This understanding has since been extended
into a generalized analysis framework (Ren et al. 2025a, 2025b),
revealing structured frequency responses that encode the inter-
play between wave propagation, cell architecture, and electro-
chemical states. These spectral structures serve as physically
meaningful fingerprints of the internal battery configuration
and are highly relevant for state-dependent analysis (Ren et
al. 2025a). However, extracting such frequency structures from
reflection signals in an efficient manner remains a technical
challenge, especially when constrained by testing time, data
volume, and real-time evaluation requirements.
Conventional approaches to ultrasonic band structure iden-
tification rely on sequential narrow-band excitations, typically
toneburst pulses, sweeping across discrete center frequencies
within the range of interest (Huang et al. 2022 Ren et al. 2023,
2025a). While this method enables effective mapping of the
frequency-dependent reflection response, it is inherently inef-
ficient, particularly when wide spectral coverage is required.
Additionally, narrow-band excitations often yield redundant
or uninformative measurements outside the sensitive fre-
quency range, reducing data storage compactness. Frequency-
modulated excitations, such as linear chirps, present a promising
alternative: by encoding a continuous range of frequencies within
a single waveform, they allow for time-compressed and spectrally
broad probing (Yang et al. 2019 Tian et al. 2024 Challinor and
Cegla 2024). However, the design and implementation of such
excitations—particularly in terms of sweep format, signal shaping,
and time-frequency characteristics—remain underexplored in the
context of ultrasonic evaluation of batteries.
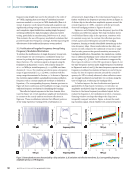
In this study, we propose a frequency-modulated
angular-sweep excitation strategy for efficiently identifying the
ultrasonic frequency response structure of multilayer pouch cells.
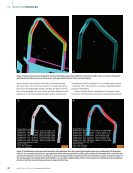
Simulation studies are conducted to compare the performance of
toneburst-based linear sweeps with frequency-modulated chirp
signals configured at various time-frequency angles. By analyzing
the resulting spectral morphologies and reflection waveforms, we
demonstrate that angular chirp excitations can achieve a sparse
yet informative description of the battery’s critical band structure,
effectively reducing measurement redundancy and enhancing
information density. We further incorporate amplitude modula-
tion to improve time localization, thereby aligning the waveform
characteristics with those of traditional pulse-echo measure-
ments and improving suitability for real-world diagnostics.
The remainder of this paper is organized as follows:
Section 2 presents the method for identifying frequency struc-
tures using both narrow-band and frequency-modulated ultra-
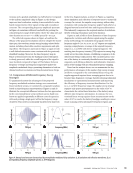
sonic excitations. Section 3 reports the simulation results and
comparative analyses between linear and angular sweep strate-
gies, including their time-frequency behavior and characteriza-
tion performance. Section 4 summarizes the main findings and
outlines the potential of the proposed approach for practical
deployment in ultrasonic battery characterization systems.
2. Methodology
This section presents a detailed formalization of ultrasonic
frequency-response structure identification for multilayer
batteries, enabling efficient and noninvasive characteriza-
tion of their critical band structures through excitation design
and wave analytics. Based on our previous work (Ren et al.
2025a, 2025b), the principle of ultrasonic frequency response
analysis is briefly outlined. Two comparative strategies are
then introduced for frequency structure identification, using
single-frequency narrow-band tonebursts and frequency-
modulated broadband chirps, respectively. Implementation
details are clearly stated to facilitate simulation-based verifica-
tion and comparison in both the time and frequency domains.
2.1. Frequency Response Structure Analysis of
Multilayer Batteries
Commercial pouch cells exhibit a multilayer internal architec-
ture, making their physical dynamics (Hsieh et al. 2015 Chang
and Steingart 2021 Fordham et al. 2023 Wasylowski et al.
2024) nondestructively identifiable using ultrasound. As illus-
trated in Figure 1a, the frequency response analysis of batteries
can be achieved via a pulse-echo setup by stimulating cells
with tailored probing waves and analyzing the dynamics of
the reflection waves resulting from wave–battery interactions.
Considering an M -layer pouch cell excited by an N S -point exci-
tation signal s t =[s t [0], ⋯ ,s t [N s − 1]]T, the ultrasonic responses
can be expressed as (Ren et al. 2025a):
(1) R t =ℋ (s t )=IDFT[H] ⊛ s t
where
R t =[r 0 ,⋯ ,r M+1] ∈ ℂ N s × (M+1) denotes the column-wise
response signal matrix for the layer interfaces {z 0 ,⋯ ,z M }
along the battery thickness, and
the reflection signal at the transducer side z 0 is given by r t =r 0.
The dynamic process of wave–battery interactions can be
conceptually represented by the system response function
ℋ :ℂ N c → ℂ N s × (M+1) .
ME
|
ELECTRICVEHICLES
46
M AT E R I A L S E V A L U AT I O N • J A N U A R Y 2 0 2 6