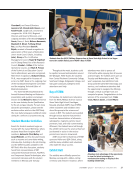
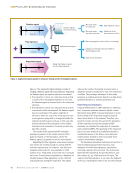
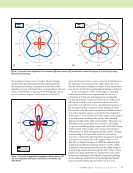
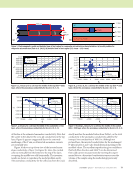
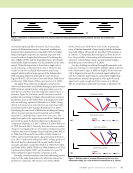
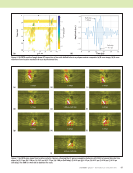
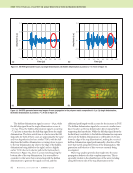
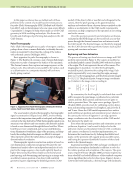
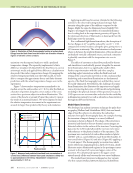
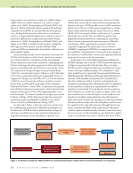
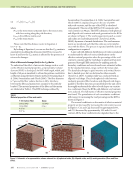
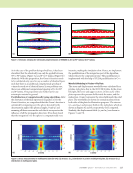
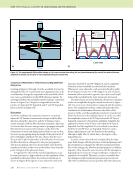
98 M A T E R I A L S E V A L U A T I O N • J A N U A R Y 2 0 2 0 marked, the thermal image projected onto an intermediate surface parameterization, and the surface parameterization projected onto the CAD model. The registration in Figure 3 was performed using OpenCV’s solvePnPRansac function based on aligning the locations of landmarks, the projected geometry via Equation 1, with their observed locations in the thermal image. In most NDE applications, the time and effort required to manually define and identify CAD model landmarks will be problematic. Fortunately, the technology to automatically track specimen position and orientation is rapidly maturing, and we are demonstrating the capability to use such position tracking in the NDE laboratory. Figure 4 illustrates the use of point cloud data from a 3D camera to automatically deter- mine both the specimen and camera/flash hood orientation (Radkowski et al. 2018), from which the specimen orientation relative to the camera can be derived as an alternative to the landmark process described above. Regardless of how the pose is determined, projecting rays via Equation 1 can be used to register thermal images onto the CAD model. Such an ability to register data to physical geometry is essential for using model-based inversion regard- less of NDE modality. Data from other imaging modalities such as visual, penetrant, and magnetic particle testing can be registered and mapped onto the geometry using the same process. Variants of the same idea can be used with other modalities, such as lensless raytracing from the X-ray tube to detector panel for radiography, or projection of an ultrasonic wave from transducer to specimen and back. Surface Parameterizations Most NDE measurements are fundamentally related to a surface. With the notable exception of X-ray and other radiog- raphy variants, almost all such measurements are performed at a surface or involve a wave transiting a surface as a critical step. It makes sense in these cases to represent the data on the surface rather than in the volume. In order to do so, we need a way to locate data points on the two-dimensional surface of the three-dimensional CAD model. This mapping between two-dimensional coordinates on a surface and the three- dimensional contours is called a “surface parameterization,” or, in the computer graphics world, “texture coordinates.” The surface parameterization assigns coordinates (u, v) to each point on the physical surface. For a meshed CAD model, each 3D facet vertex (X, Y, Z) gets mapped explicitly to a 2D location (u, v). The projection of the image from Figure 3b into surface parameterization coordinates is shown in Figure 3c. The parameterized surface is readily re-projected onto the CAD model surface (Figure 3d). The choice of surface parameterization is arbitrary but significant. In some cases, there will already be a surface para- meterization. For example, tubular structures such as pipelines or airplane fuselages are commonly parameterized by axial and circumferential position. All surface parameteriza- tions will have “seams,” the boundaries such as between the different regions in Figure 3c where the surface is cut to allow the object to be flattened out. The surface parameterization will be a convenient domain for computing certain sorts of models, but distortion in the surface parameterization is often unavoidable. Either the model will need to be programmed to operate on a distorted domain, or it will be constrained to ME TECHNICAL PAPER w nde modeling in 3d cad Figure 4. Use of point cloud data from a 3D camera to automatically determine both specimen and camera/flash hood orientation: (a) photograph of flash hood and specimen (b) point cloud with interpreted orientation of specimen CAD model highlighted in green. (a) (b) Camera Specimen Flash hood

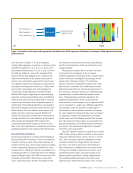
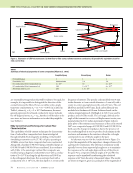
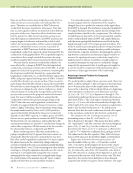
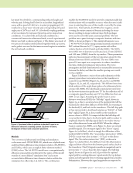
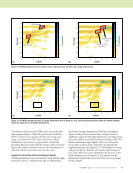
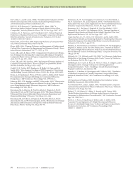
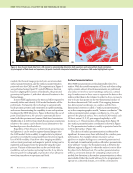
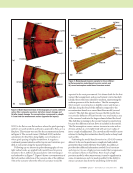
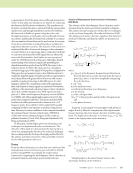
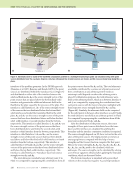
J A N U A R Y 2 0 2 0 • M A T E R I A L S E V A L U A T I O N 99 geometries formed from “developable” surfaces (Kreysig 1991) that can be represented without distortion. Surfaces, such as spherical or saddle-shaped, that curve along both axes are not “developable” and it is not mathemati- cally possible to parameterize them without distortion. Para- meterizing a nondevelopable surface is akin to the cartographic problem of representing the sphere of the Earth on a flat map. There is no single ideal solution. At minimum, either angles or scaling will be distorted. The NDE model will need to be formulated and programmed to accommodate the type of distortion in the parameterization. A “conformal” parameterization (Kreysig 1991), which allows differences in scaling but locally protects angles from distortion, will probably be the easiest to accommodate in NDE models. CAD models made up of free-form surfaces are usually represented using nonuniform rational B-splines (NURBS). NURBS surfaces have an implicit parameterization associated with them. While in principle this parameterization could be directly used for mapping the NDE data, it may not align with principal measurement directions and may not satisfy desired constraints such as conformality. Therefore, it will often be necessary to have a separate parameterization of the surface independent from the implicit NURBS parameterization. In the work presented here, we exported the CAD model as a boundary mesh. Then we used the open-source Blender (Blender 2017) computer graphics tool to mark sharp edges in the model to serve as seams in the parameterization. Then we used the computer graphics tool’s implementation of the least squared conformal mapping (LSCM) algorithm (Lévy et al. 2002) to generate a conformal parameterization with large margins around regions in parameterization space. Moreover, surface parameterization coordinates are important because they provide a domain for data fusion. NDE measurements taken with different systems or different modalities or at different times can potentially be included in “digital thread” or “digital twin” models of the structure. For such data to be useful it will need to be stored in a common coordinate space so that it can be readily compared and/or fused. A standardized surface parameterization is a common coordinate space. Multiple data sets recorded under the same surface parameterization are straightforward to fuse for trend analysis or to compare the same indication across modalities. Surface parameterizations also prospectively provide a means to reconcile geometric inconsistencies between the CAD model and physical part. Built parts can easily end up substan- tially distorted relative to the CAD design due to bending displacements. Any situation where the model and physical object differ by more than a few millimeters will cause major problems in projecting the data onto the CAD model. While out-of-plane displacements due to bending might be large, distortion in parameterization space will be much smaller because it is related to in-plane strains and displacements rather than bending displacement. Use of Models to Improve Understanding of Experiment Now that we can accommodate nontrivial geometries in our measurements, we are faced with an NDE process that has been affected by the curvature of the specimen. In this context, we are interested in understanding the performance of pulse thermography of curved carbon fiber composites, and in particular any differences in heat flows around tight bends. We experimented with the L cross-section stiffener shown in Figure 5a that consists of two 25 mm flanges connected by a 90° bend. It was tested inside a reflective flash hood using the geometry shown in Figure 5b. The heating of the outer surface of the bend by the flash is illustrated schematically in Figure 6. We predicted that heat would accumulate (higher temperature) on the convex side of the bend because of the large surface area compared to a reduced volume for the flash heat to diffuse into. Heat would concentrate in the curved region, leading to a higher tempera- ture. To quantify this prediction, we developed a theory for heat flow in curved anisotropic media (Frishman and Holland 2019) that gives approximate Green’s functions for the heat flow. We integrated the Green’s function response to the flash Figure 5. Setup for evaluating differences in heat flows around tight bends: (a) right-angle stiffener and (b) stiffener orientation inside flash hood relative to flash lamps and thermal camera. (a) (b) Flash lamp Thermal camera Flash lamp Stiffener
ASNT grants non-exclusive, non-transferable license of this material to  .
All rights reserved. © ASNT 2026. To report unauthorized use, contact: customersupport@asnt.org