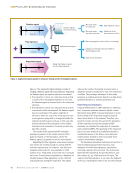
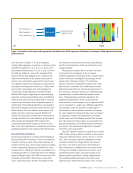
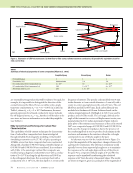
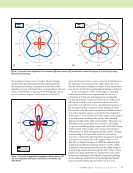
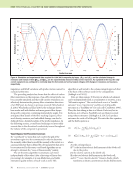
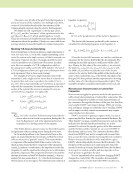
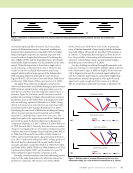
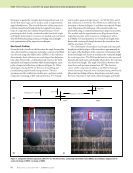
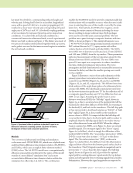
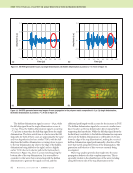
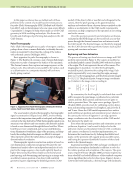
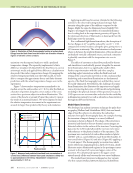
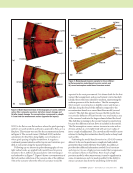
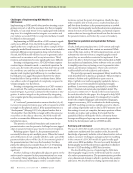
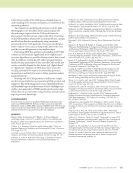
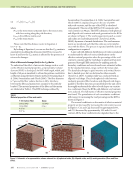
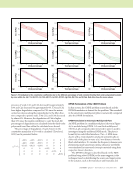
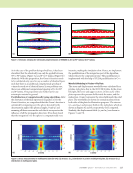
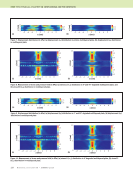
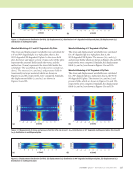
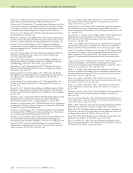
92 M A T E R I A L S E V A L U A T I O N • J A N U A R Y 2 0 2 0 The hidden-delamination signal occurs at ~19 μs, while the full-skip signal from the single delamination occurs at ~11.5 μs. Thus, the hidden-delamination signal is occurring ~7.5 μs later in time than the full-skip signal from the single delamination. The later arrival time is of note since the full- skip paths for both of these cases are approximately the same and were hypothesized to have similar TOFs, with the full- skip from the hidden delamination occurring closer in space to the top-delamination tip (due to the edge of the hidden delamination being shifted to the right) and at a slightly earlier TOF (due to its shorter path to the back surface). However, in Figure 12a, there is a wave traveling along the bottom side of the top delamination. It is reasonable to consider it is this wave that is interacting with the hidden delamination to generate the signal received, and this additional path length would account for the increase in TOF. The hidden-delamination signal also occurs at a similar trans- ducer location as the top delamination direct signal, further supporting this hypothesis. While the full-skip signal from the backwall may contribute to the hidden-delamination response observed, the hidden delamination is well hidden (3.81 mm from the edge of the top delamination), making the received hidden-delamination signal predominantly a function of the wave that travels along the bottom of the delamination. The generation and behavior of this wave are currently being investigated. Wave-map analysis provides key insight into the wave propagation behavior for this complex inspection. This is especially evident in the identification of the wave traveling along the bottom side of the top delamination in the ME TECHNICAL PAPER w angle-beam pulse-echo ultrasonic inspection 6 8 1.0 0.5 0 —0.5 —1.0 10 12 14 16 18 20 22 Time (μs) 6 8 1.0 0.5 0 —0.5 —1.0 10 12 14 16 18 20 22 Time (μs) Figure 11. SA-FDTD generated A-scans: (a) single delamination (b) hidden delamination at position x = 2.9 mm in Figure 10. (a) (b) Figure 12. SA-FDTD generated wave-map images of wave propagation in the polymer matrix composite at 9.5 μs: (a) single delamination (b) hidden delamination at position x = 2.9 mm in Figure 10. (a) (b) Amplitude (a.u.) Amplitude (a.u.)

J A N U A R Y 2 0 2 0 • M A T E R I A L S E V A L U A T I O N 93 hidden-delamination case. Alternative techniques to observe wavefields experimentally exist, but it is not possible to use them in the case of bulk-wave propagation in carbon fiber composites. Schlieren techniques require transparent materials, and laser-based full-wavefield imaging captures only signals that reach the surface being scanned. It may be possible to identify the backwall skip signals from delaminations in experimental data with a combination of ray-tracing estimates, training, and experience however, identifying the signals from backwall skips from a hidden delamination is challenging with relatively weak signals spread out over a large spatial distance. The example shown here is also from a simulation, which is ideal- ized and noise-free, whereas real experimental data will be harder to interpret. It is quite feasible that SA-FDTD and FEM models can be used to assist in determining the source of signals in a real inspection by correlating the experimental signals to models that mimic the experimental configuration. Conclusions The complex nature of angle-beam pulse-echo ultrasound is further complicated when it is performed on a layered anisotropic material with a focused transducer, particularly when the specimen is very close to the face of a focused trans- ducer, as was the case for the results presented here. Near the face of a focused transducer there are side lobes present that are created by the lens. These side lobes dissipate rapidly with distance, and the side lobes are rarely seen when a focused transducer is used for normal-incidence inspections. The effect of the focused transducer side lobes is seen in these examples because of the short focal length (11.4 mm), very short water path length (7 mm), and the transducer being used in an angle-beam configuration. It is the complexity of the problem that makes understanding the experimental results virtually impossible without some form of model to inform the interpretation. The results of benchmark studies performed with a SA-FDTD model are compared to results from a FEM model and experimental data for model verifica- tion. Results using side-drilled holes as discontinuities show reasonable agreement among the three. The FEM model gave the closest predictions of signal TOF and location for SDH1, while the SA-FDTD model gave the closest predictions for SDH2. It was expected that the FEM model would give the closest predictions in all cases. The conditions under which a SA-FDTD model would give results closer to experiments than a FEM model are under investigation. In general, the differences between the models can be attributed to the use of a semianalytical beam model, with Auld’s reciprocity theorem, in the SA-FDTD model versus solving the probe model numerically in the FEM model. Additionally, the sharp focus of the transducer, oblique angle, layered anisotropic specimen, and close proximity of the near- field to the top surface are also expected to cause numerical differences between the two models. Thus, small differences between the two are not surprising. These factors also account for the differences between the SA-FDTD model and the experiments. The FEM model is expected to more closely represent the experiments than the SA-FDTD model, and in general it does. However, the FEM model also uses simpli- fying assumptions to model the transducer. These assump- tions are very reasonable for normal-incidence inspections of homogeneous materials. However, for the case illustrated here consisting of a layered anisotropic material, oblique-incidence excitation, and a focused-beam transducer, the small errors these assumptions introduce are compounded at each layer interface, which is not a problem seen when using the FEM model to model normal-incidence inspections. The SA-FDTD model results were easier to interpret since they did not account for the near-field effects of this particular inspection. However, the FEM model more closely repre- sented the experimental return signals. This case illustrates how models are not necessarily better or worse than one another, but instead are complimentary. Simple and realistic models both provide insight that aids in understanding the results from complex inspections. They also demonstrate the usefulness of SDH benchmarking studies that aid in inter- preting the responses that occur in actual inspections. The utility of computational models to determine the source of signals through the use of wave maps and time stepping has been shown for both the SDH benchmarking cases and a real- istic hidden-delamination model. This wave-map technique has potential application to the interpretation of complex signals in experimental data through quantitative time-spatial signal comparisons as well. Model results for a realistic hidden delami- nation demonstrate that a hidden delamination causes a readily discernible signal response in oblique-angle pulse-echo ultra- sonic inspections. This is encouraging for the development and optimization of an angle-beam pulse-echo inspection for hidden delamination characterization. ACKNOWLEDGMENTS The authors would like to acknowledge Norman Schehl for his work in design and fabrication of the fixturing to enable the measurements to be taken with air on the backwall, and the many fruitful technical discussions during this effort with numerous colleagues in the Materials State Aware- ness Branch and UDRI. The authors gratefully acknowledge the helpful comments and suggestions of the reviewers that strengthened the paper. Portions of this work were conducted under US Air Force contracts FA8650-15-D-5231 TO 001 and FA8650-14-D-5224 TO 001. REFERENCES Abrate, S., 1998, Impact on Composite Structures, Cambridge University Press, Cambridge. Aldrin, J.C, J.N. Wertz, J.T. Welter, S. Wallentine, E.A. Lindgren, V. Kramb, and D. Zainey, 2018, “Fundamentals of Angled-Beam Ultrasonic NDE for Potential Characterization of Hidden Regions of Impact Damage in Composites,” AIP Conference Proceedings, Vol. 1949, No. 1. Babish, C.A., 2008, “USAF ASIP: Protecting Safety for 50 Years,” Aircraft Structural Integrity Program Conference, San Antonio, TX. Bar-Cohen, Y., and R.L. Crane, 1982a, “Acoustic-Backscattering Imaging of Subcritical Flaws in Composites,” Materials Evaluation, Vol. 40, No. 9, pp. 970–975.
ASNT grants non-exclusive, non-transferable license of this material to  .
All rights reserved. © ASNT 2026. To report unauthorized use, contact: customersupport@asnt.org