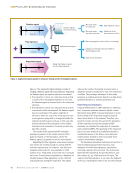
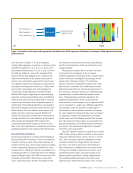
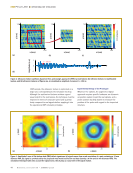
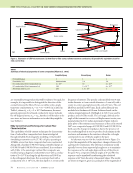
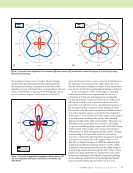
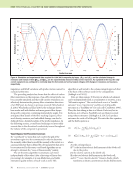
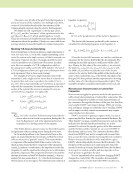
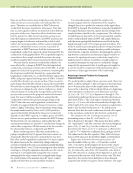
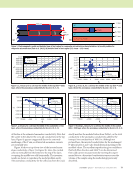
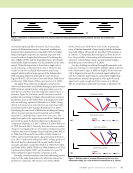
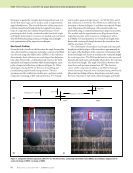
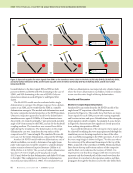
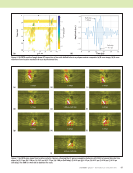
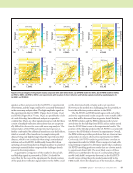
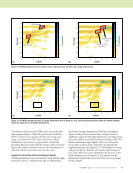
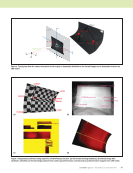
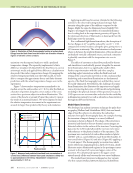
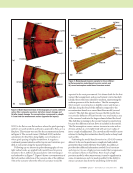
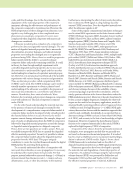
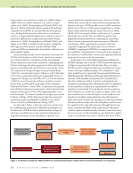
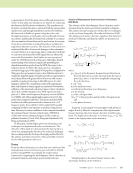
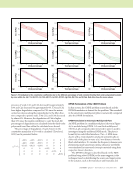
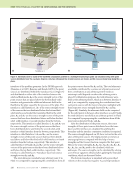
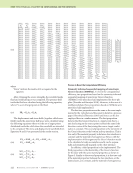
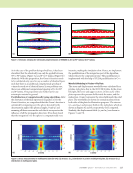
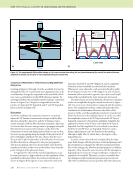
100 M A T E R I A L S E V A L U A T I O N • J A N U A R Y 2 0 2 0 excitation over the exposed surface to yield a predicted temperature change. We separately implemented a finite difference simulator (Holland 2018) for heat flows in curved, anisotropic media and applied finite difference calculations to also predict the surface temperature change. By mapping the observed temperature field onto the CAD model, we were able to compare the approximate theory and finite element predictions with the actual temperature changes seen in the experiment. Figure 7 shows surface temperature normalized to its median across the entire surface at t = 0.25 s after the flash, as a function of position along the convex surface of the cross section for a specimen subject to uniform illumination. The center of the bend is at around 27 mm (the peak at 13 mm is the result of an internal feature). We were surprised to find the relative temperature increment in the experiment was around 4× larger than predicted by theory and simulation. Applying model-based inversion (detailed in the following section) to the observed heating indicated stronger flash intensity along the spine of the stiffener compared to the flanges. Might the spine be illuminated more brightly? We began to investigate the possibility of nonuniform illumina- tion. Looking back at the experiment geometry of Figure 5b, the dominant direction of illumination is downward from the flash lamps onto the specimen. For a collimated light beam from above, the absorption of the two flanges at 45° would be reduced by cos 45° = 1/#2 compared to normal incidence along the spine, giving rise to a 41% increase in intensity. The actual situation is clearly some- where in between the uniform illumination of the models and an idealized vertically collimated source, and such a situation is plausibly consistent with the temperature rise seen in Figure 7. The effect of curvature on heat flow predicted by theory and simulation is undoubtedly present alongside the nonuni- form illumination, but it is a significantly smaller effect. Further experimentation with this and other samples, including angled orientations within the flash hood and testing of the concave side, have led us to the conclusion that shadowing and nonuniform illumination are fundamental aspects of the flash thermography test, and that they cannot be readily eliminated. Nevertheless, the challenge of nonuni- form illumination also illustrates the importance and signifi- cance of projecting data onto a CAD model and performing modeling in the physical domain of the specimen, because in CAD space we can accommodate and solve for the variability in illumination intensity (as well as subsurface characteristics) through model-based inversion. Model-Based Inversion We developed an analysis/inversion technique for pulse ther- mography (Holland and Schiefelbein 2019) that uses knowl- edge of heat flow physics to determine the subsurface structure from pulse thermography data. An example showing the inversion of impact damage to a curved, stiffened specimen is shown in Figure 8. The shape of the structure is nontrivial and therefore the raw thermal camera images are distorted relative to the surface of the structure. Projecting the data onto the CAD model allowed the inversion to be done with reference to the physical surface of the specimen. The specimen was constructed of carbon fiber reinforced plastic (CFRP) with co-cured stiffeners made from fiber bundles. It was tested before (Figure 8a) and after (Figure 8b) applying a 7.5 joule impact. The thermography reconstruction, which shows reflections originating from a depth of 0.5 mm, clearly illustrates major delaminated regions in the postimpact meas- urement in the lower left corner and upper center of the specimen. The delaminated region in the upper center extends nearly all the way between the two curved stiffeners. The model-based inversion technique has two variants. The first variant (Holland 2018 Holland and Schiefelbein ME TECHNICAL PAPER w nde modeling in 3d cad Figure 6. Illustration of flash thermography heating at a sharp bend. Energy from the flash flows from the surface into a smaller volume in regions of extreme convex curvature. 10 0.9 1.0 1.1 1.2 1.3 1.4 15 20 Position (mm) 25 30 35 Experimental From approximate theory From simulation Figure 7. Measured and predicted/simulated heat concentration at convex bend. Difference between theory and simulation is likely due to approximations in the theory. (Quantitative comparison at approximately t = 0.25 s). Normalized temperature due to flash

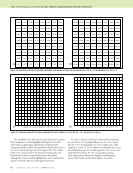
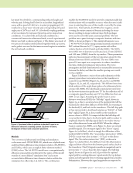
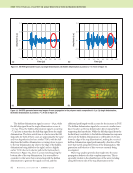
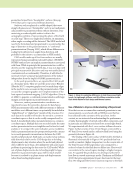
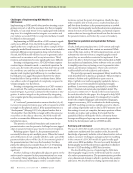
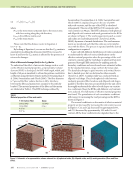
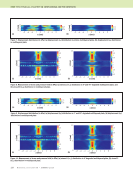
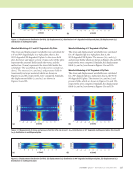
J A N U A R Y 2 0 2 0 • M A T E R I A L S E V A L U A T I O N 101 2019) is for flat or near-flat surfaces where the pixel spacing is uniform or nearly uniform and heat is assumed to flow, as in a flat plate. This variant was used for the reconstruction shown in Figure 8. The second variant (Holland 2019) includes calculations for heat flow along highly curved surfaces or where pixel spacing is highly nonuniform. It requires a conformal parameterization with step size and curvature spec- ified at each point along the parameterization. Following up our interest in pulse thermography of very tight radius bends, we applied both model-based inversion variants to the L stiffener discussed above (25 mm flanges) and referred to in Figure 7. Figure 9 shows a reconstruction of the back surface reflection of the concave side of the stiffener. This is the scenario where the effect of curvature would be expected to be most pronounced. It is shown both for the first variant (flat assumption) and second variant (curved model). Ideally, these reflections should be uniform, representing the uniform presence of the back surface. The flat assumption (first variant) reconstruction is slightly noisier and shows a dark line along the bend of the stiffener compared to the reconstruction based on a curved heat flow model (second variant). The dark line appears because the flat model does not consider diffusion of heat from the very small surface area of the concave bend into the larger volume behind the bend. The dark line is missing in the second variant reconstruction because the difference in heat flows is included in the model. The flat assumption causes a minor increase in noise and an obvious artifact at a very tight bend with an inner radius of just a couple of millimeters. The curved model would be most relevant to finding discontinuities directly under a sharp bend such as this. Performing the model-based inversion in a 3D CAD context allows it to be used in much more complicated and realistic geometries than would otherwise be possible. In addition, it provides the additional information needed (local curvature and step size) to use a high-precision model that compensates for curvature effects on heat flows. Even if such a high- precision model is often unnecessary, it may be significant in some circumstances and it is made possible by the ability to extract curvature data from the underlying CAD model. GOWJOT BESRUZ SUNJIC YOVWAW SIKNAT SIKNAT JERNUH CERNON LIQYES GOWJOT BESRUZ SUNJIC YOVWAW JERNUH CERNON LIQYES Figure 8. Model-based inversion of thermography of curved, stiffened carbon fiber composite specimen: (a) before impact damage and (b) after impact damage. The reconstruction corresponds to a depth 0.5 mm from the measurement surface (opposite the impact). (a) (b) RAPLUC RIZTEC XATWAX MUFVAX DABDIM RIZTEC DABDIM MILMED RAPLUC MILMED GAVMEN XATWAX MUFVAX GAVMEN Figure 9. Model-based inversion variants for the L stiffener: (a) flat-assumption model-based inversion variant and (b) curved-assumption model-based inversion variant. (a) (b)
ASNT grants non-exclusive, non-transferable license of this material to  .
All rights reserved. © ASNT 2026. To report unauthorized use, contact: customersupport@asnt.org