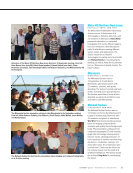
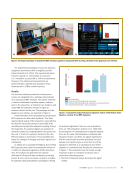
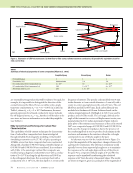
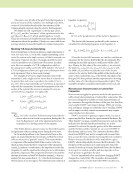
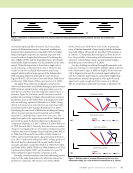
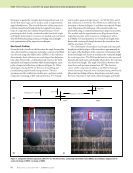
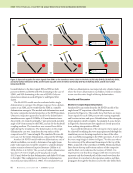
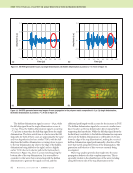
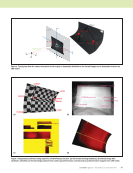
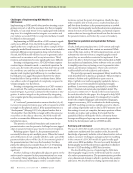
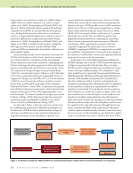
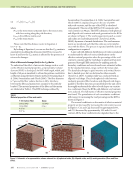
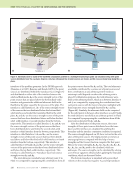
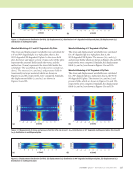
84 M A T E R I A L S E V A L U A T I O N • J A N U A R Y 2 0 2 0 this paper to guide this complex data interpretation task. It is shown that wave maps can be used to assist in experimental signal identification. The second objective of this paper is to perform model benchmark studies for angled-beam inspec- tions of composites and validate the performance of two promising models. Lastly, simulated results from both single and hidden delamination scenarios are studied and contrasted with SDH benchmarking results, providing critical insight into optimization of the inspection technique. Benchmark Problem Given the lack of results in the literature for angle-beam pulse- echo ultrasound for composite materials, a canonical problem was devised using side-drilled holes (SDHs) as the reference discontinuity. Such reflectors are much larger than delamina- tion edges but provide a well understood response for both simulated and empirical studies while maintaining the same paths of expected reflections as shown in Figure 2b. Other advantages of using SDHs are the ease of modeling and manufacturing experimental test specimens. The test specimen used for verification studies was a polymer matrix composite consisting of IM7 carbon fiber in a 977-3 epoxy matrix with a quasi-isotropic layup [–45/90/45/0]3s, and it had a thickness of 3.24 mm. Two SDHs were drilled into the specimen as shown in Figure 3, and they were spaced 50 mm apart. Experimental verification of the model results was performed using a commercial immersion inspection system. The models and the experiments were all performed in an angled-beam pulse-echo immersion configuration with a 2.25 MHz, 6.35 mm diameter, 11.43 mm focal length trans- ducer with a water-path length between the transducer face and the specimen of 7 mm. The combination of transducer focal length and water path length places the focal spot of the transducer approximately in the center of the thickness of the composite. A transducer with short focal length was chosen to minimize the water path length for a real inspection. The FEM model run time also increased dramatically with water path length, which drove the selection of a short focal length. The angle of incidence between the transducer and specimen normal was 18°. The slowness curves of the composite, modeled as an effective homoge- neous anisotropic material, were calculated using commercial ultrasound modeling software. Anisotropic materials cause the wave velocities to vary with a refracted angle, and Snell’s ME TECHNICAL PAPER w angle-beam pulse-echo ultrasonic inspection 1.746 mm 0.468 mm Thickness = 3.24 mm 2.27 mm 1.02 mm SDH2 SDH1 Distance = 50 mm Figure 3. Composite reference specimen, IM7/977-3 [–45/90/45/0]3s, containing side-drilled holes (SDHs): (a) schematic diagram (not to scale) (b) image of SDH1 (c) image of SDH2. (a) (b) (c)

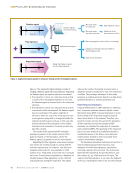
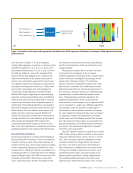
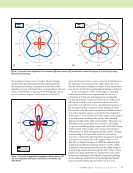
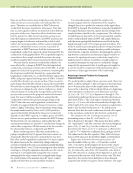
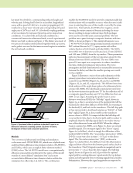
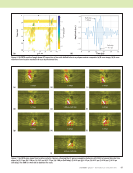
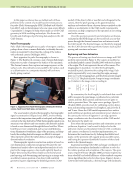
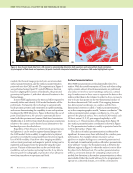
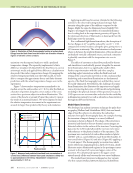
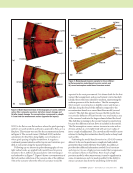
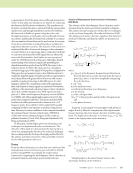
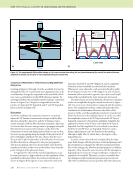
J A N U A R Y 2 0 2 0 • M A T E R I A L S E V A L U A T I O N 85 law must be solved for a corresponding refracted angle and velocity pair. Solving Snell’s law for an incident longitudinal wave, with a speed of 1481 m/s, in water propagating at 18°, resulted in a shear-wave velocity and corresponding refracted angle pair of 2679 m/s and 34°. A backwall coupling medium of air was desired to represent typical in-service inspection conditions. To achieve the air backwall condition in a commercial immersion ultrasound tank, a novel experimental fixture was built as shown in Figure 4. The fixture was made of two pieces of stainless steel fastened together with cap screws, and a gasket was used in the inner recessed region to maintain the air backwall condition. Models Two commercial ultrasound modeling and simulation codes were used: CIVA FIDEL 2D, which uses a hybrid semi- analytical finite-difference time-domain solution (SA-FDTD), and PZFlex, which uses an explicit finite-element method (FEM) solver. The SA-FDTD model uses a computationally efficient, semi-analytical solution for the region of the model outside of a user defined “simulation box” and a more accurate finite-difference time-domain solution within the simulation box (Reverdy et al. 2015). The combination enables the SA-FDTD model to provide computationally fast solution times with acceptable accuracy when the user is judi- cious in selecting the zone of the model covered by the simu- lation box. Alternatively, the FEM solver requires a mesh covering the entire numerical domain including the trans- ducer, resulting in longer solution times. Both packages were used to solve the same canonical problem. The test problem was a quasi-isotropic composite laminate with two SDHs as shown in Figure 3. The simulated laminate was a [–45/90/45/0]3s layup using nominal material properties of IM7 carbon fiber and a 977-3 epoxy matrix with a fiber volume fraction of 0.6 (Daniel and Ishai 2006). The SDHs were 0.955 mm in diameter and located at 2.27 mm (SDH1) and 1.02 mm (SDH2) from the top surface. These parameters replicated measurements of the test specimen except for the distance between SDH1 and SDH2. The two SDHs were spaced 16 mm apart as a compromise to reduce simulation run time, while preventing any interactions. The wave- propagation models demonstrated no measurable interaction between the holes, and thus the smaller spacing was consid- ered acceptable. Figure 5 illustrates a series of ray-path schematics of the primary quasi-shear wave interactions as the transducer is scanned toward SDH1 (Figures 5a, 5b, and 5c) and SDH2 (Figures 5d, 5e, and 5f), respectively. This follows from simu- lated analyses of the angle-beam pulse-echo ultrasound inter- actions with SDHs. The shorthand nomenclature used here for the wave-interaction paths uses “B” for the reflection off of a composite-panel boundary and “D” for diffraction from an SDH (or an edge). Assuming the probe beam is some distance away from SDH1, the “full-skip” signal, shown in Figure 5a, is due to an interaction of the incident field off the backwall, B, which then diffracts off the SDH, D, returning to the backwall, B, and back to the transducer. This full-skip path is thus represented in shorthand notation as “B-D-B.” A “half- skip” signal, Figure 5b, is also possible as the transducer moves closer to SDH1. It is expected that the half-skip will occur earlier in time due to its shorter path, and be weaker in amplitude than the full-skip signal due to its weaker interac- tion of the ultrasonic beam with SDH1. When the oblique beam is centered on SDH1, as in Figure 5c, there are several possible signals. The strongest signal is the “direct” signal, Figure 5c (solid line), which is simply the diffraction of the incident field by SDH1. The “near-surface interaction” (NSI), D-B-D, occurs very close in time (~ 0.75 μs) to the direct signal. The “far-surface interaction” (FSI), as shown in Figure 5c (dashed line), first diffracts from the delamination edge and then reflects from the bottom panel surface back to the transducer. The FSI signal is smaller in magnitude and is later in time (~ 1.5 μs) than the direct signal. The full-skip signal, shown in Figures 5a and 5d, provides the optimal signal path for sending ultrasonic signals under the top delami- nation and subsequently detect returning signals from a hidden delamination. However, the signal magnitudes are expected to Cutout Gasket Composite Recessed Figure 4. Specimen holder to perform air-backed C-scan in an immersion ultrasonic scanning system: (a) photo of fixture (b) diagram of fixture and composite placement. (a) (b)
ASNT grants non-exclusive, non-transferable license of this material to  .
All rights reserved. © ASNT 2026. To report unauthorized use, contact: customersupport@asnt.org